
Chart · Our World in Data
ChartOur World in Data
Annual growth of the income or consumption of the poorest 40% vs. the total population
The growth rate is calculated between two household surveys – the most recent survey available in 2024 and a survey falling approximately five years earlier. In countries below the dotted line, income or consumption growth is higher for the poorest 40% of the population than the national average.
Copy actions record publisher intent only. They do not confirm publication, citation or a backlink.
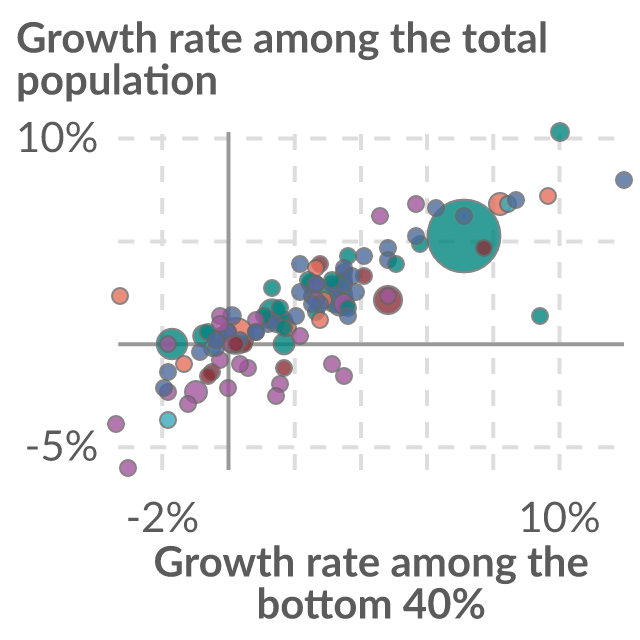
Data visualization loaded directly from Our World in Data.
Reuse conditions
Usage rights
- Source-hosted embed use
- Commercial use
- Modification
- Attribution
- Citation
- Raw-data redistribution
Chart and embed permission is separate from raw-data redistribution. The raw dataset is not included in this marketplace asset unless that right is explicitly marked allowed.
View rights evidencePublisher workflow
Exact citation
World Bank
Attribution: WB
Source-hosted only
Embed instructions
<iframe src="https://citesupply.com/e/annual-growth-income-consumption-poorest-vs-total-population" title="Annual growth of the income or consumption of the poorest 40% vs. the total population" loading="lazy" referrerpolicy="strict-origin-when-cross-origin" sandbox="allow-scripts" style="width:100%;height:720px;border:0;display:block"></iframe>
Embeds stay hosted by the source. Cite Supply records an aggregate iframe-load signal before redirecting to the reviewed source embed; it does not proxy or republish the chart.