Chart · Our World in Data
ChartOur World in Data
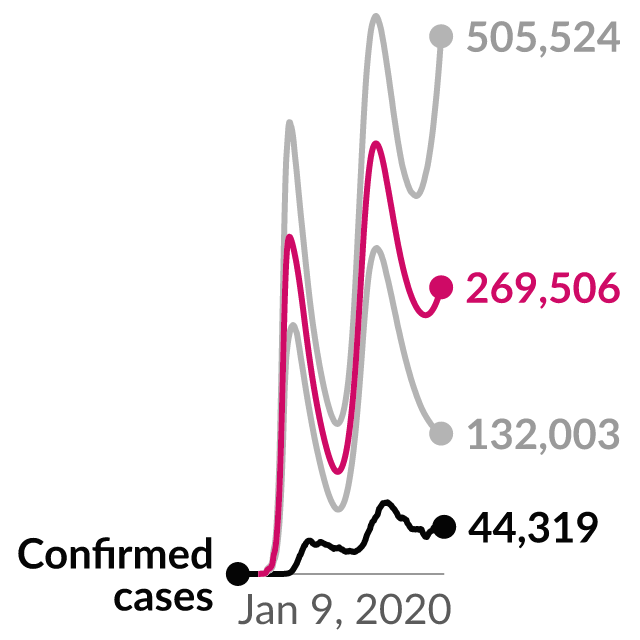
Daily new estimated COVID-19 infections from the YYG model
Estimates of the true number of infections. The "upper" and "lower" lines show the bounds of a 95% uncertainty interval. For comparison, confirmed cases are infections that have been confirmed with a test.
Copy actions record publisher intent only. They do not confirm publication, citation or a backlink.
Data visualization loaded directly from Our World in Data.
Reuse conditions
Usage rights
- Source-hosted embed use
- Commercial use
- Modification
- Attribution
- Citation
- Raw-data redistribution
Chart and embed permission is separate from raw-data redistribution. The raw dataset is not included in this marketplace asset unless that right is explicitly marked allowed.
View rights evidencePublisher workflow
Exact citation
Youyang Gu (2020); World Health Organization (2026)
Attribution: WHO
Source-hosted only
Embed instructions
<iframe src="https://ourworldindata.org/grapher/daily-new-estimated-covid-19-infections-yyg-model?embed=1" title="Daily new estimated COVID-19 infections from the YYG model" loading="lazy" referrerpolicy="strict-origin-when-cross-origin" sandbox="allow-scripts" style="width:100%;height:720px;border:0;display:block"></iframe>
Embeds stay hosted by the source; this marketplace does not proxy or republish the underlying chart.