Chart · Our World in Data
ChartOur World in Data
Contribution to value added vs. share of CO₂ emissions in China
Contribution of individual sectors to net economic output versus its share of total national carbon dioxide (CO₂) emissions in 2009. Sectors which lie above the line contribute more to the value added than to the emissions in China. Direct emissions of households are not included.
Copy actions record publisher intent only. They do not confirm publication, citation or a backlink.
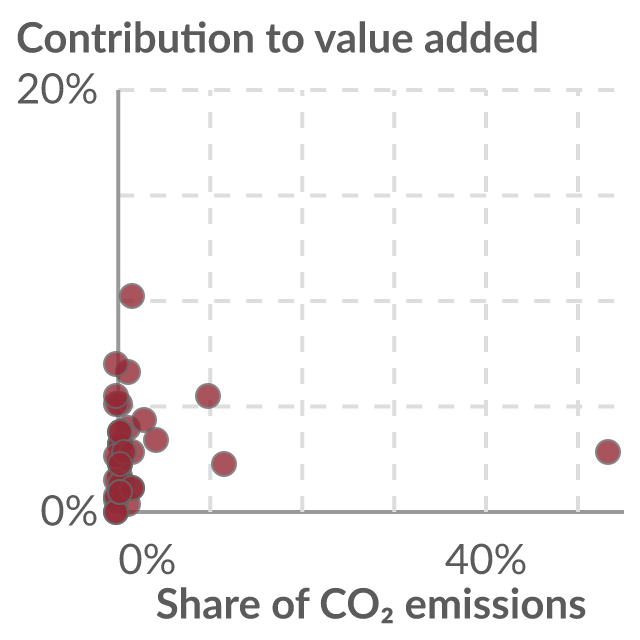
Data visualization loaded directly from Our World in Data.
Reuse conditions
Usage rights
- Source-hosted embed use
- Commercial use
- Modification
- Attribution
- Citation
- Raw-data redistribution
Chart and embed permission is separate from raw-data redistribution. The raw dataset is not included in this marketplace asset unless that right is explicitly marked allowed.
View rights evidencePublisher workflow
Exact citation
(WIOD) World Input-Output Dataset
Attribution: Timmer et al.
Source-hosted only
Embed instructions
<iframe src="https://citesupply.com/e/value-added-vs-share-of-emissions-china" title="Contribution to value added vs. share of CO₂ emissions in China" loading="lazy" referrerpolicy="strict-origin-when-cross-origin" sandbox="allow-scripts" style="width:100%;height:720px;border:0;display:block"></iframe>
Embeds stay hosted by the source. Cite Supply records an aggregate iframe-load signal before redirecting to the reviewed source embed; it does not proxy or republish the chart.