
Chart · Our World in Data
ChartOur World in Data
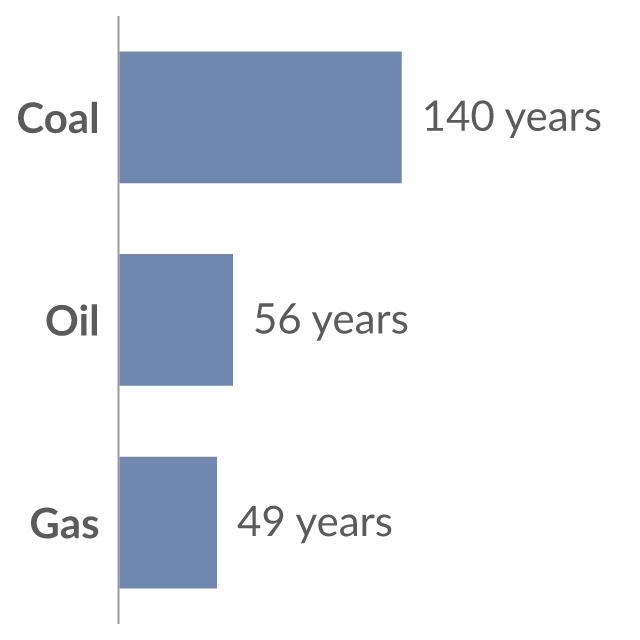
Years of fossil fuel reserves left
Years of global coal, oil and natural gas left, reported as the reserves-to-product (R/P) ratio which measures the number of years of production left based on known reserves and present annual production levels. Note that these values can change with time based on the discovery of new reserves, and changes in annual production.
Copy actions record publisher intent only. They do not confirm publication, citation or a backlink.
Data visualization loaded directly from Our World in Data.
Reviewed context
What this data shows
Energy Institute 2026 release · OWID update 30 Jun 2026 · Editorial version 1.0.0
What does the reserves-to-production ratio say about remaining fossil-fuel reserves?
The chart shows how many years proved reserves would last if production continued at that year's rate. In the latest observations, which are from 2020, the ratios are 48.5 years for gas, 140.3 years for coal and 56.4 years for oil. These are conditional ratios, not forecasts of when a fuel will run out.
How to read it
Our World in Data calculates each ratio by dividing proved reserves by production of the same fossil fuel in the same year, using the Energy Institute Statistical Review of World Energy.
The displayed values are rounded to one decimal place. The reviewed source values and calculations remain unrounded in the evidence contract.
Observation coverage
- Unit
- Years
- Period
- 1980–2020 for gas and oil; 2020 only for coal
- Geography
- World
- Frequency
- Annual where observations are available
- Series
- Gas, coal and oil reserves-to-production ratios
Limitations
- The latest observations in this chart are from 2020 even though the source metadata was updated in 2026.
- Reserves and production can change with discoveries, prices, technology, reporting and revisions, so the ratio is not a fixed countdown.
- Coal has only one observation in this chart and cannot support a trend.
- The series describes the world total and does not represent individual countries.
Reuse conditions
Usage rights
- Source-hosted embed use
- Commercial use
- Modification
- Attribution
- Citation
- Raw-data redistribution
Chart and embed permission is separate from raw-data redistribution. The raw dataset is not included in this marketplace asset unless that right is explicitly marked allowed.
View rights evidencePublisher workflow
Exact citation
Energy Institute – Statistical Review of World Energy (2026)
Attribution: Energy Institute
Source-hosted only
Embed instructions
<iframe src="https://citesupply.com/e/years-of-fossil-fuel-reserves-left" title="Years of fossil fuel reserves left" loading="lazy" referrerpolicy="strict-origin-when-cross-origin" sandbox="allow-scripts" style="width:100%;height:720px;border:0;display:block"></iframe>
Embeds stay hosted by the source. Cite Supply records an aggregate iframe-load signal before redirecting to the reviewed source embed; it does not proxy or republish the chart.