Where publishers find data.

Results for “Life expectancy”

Source links, freshness and reuse rights stay visible on every result.

Page 3 · 13 results
Filters
FiltersClear
Asset type
Source
Commercial use
Rights review
Freshness
PreviewSubmitted image
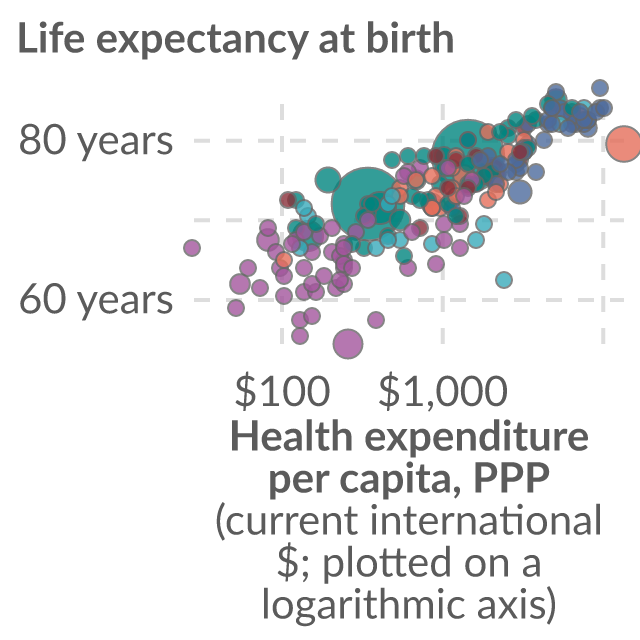
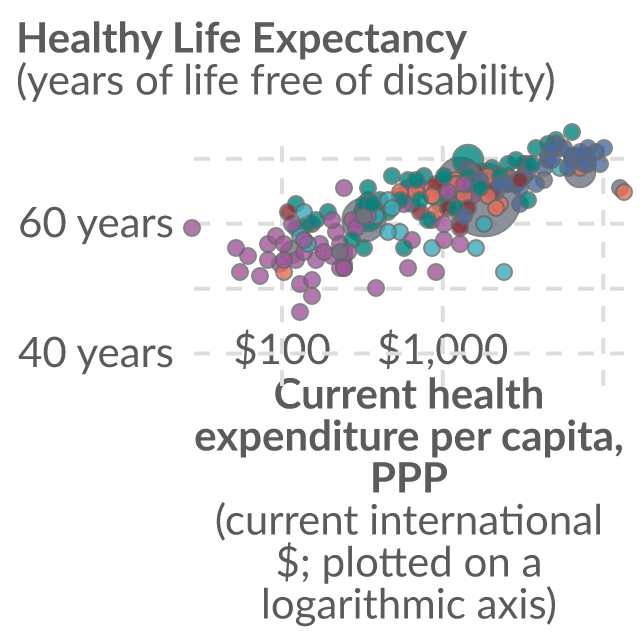
Preview of Life expectancy vs. health spending
ChartOur World in Data

Life expectancy vs. health spending

The period life expectancy at birth, in a given year. Health expenditure includes all financing schemes and covers all aspects of healthcare. This data is adjusted for differences in living costs between countries.

Source
Our World in Data
Updated
27 Jul 2026
PreviewSubmitted image
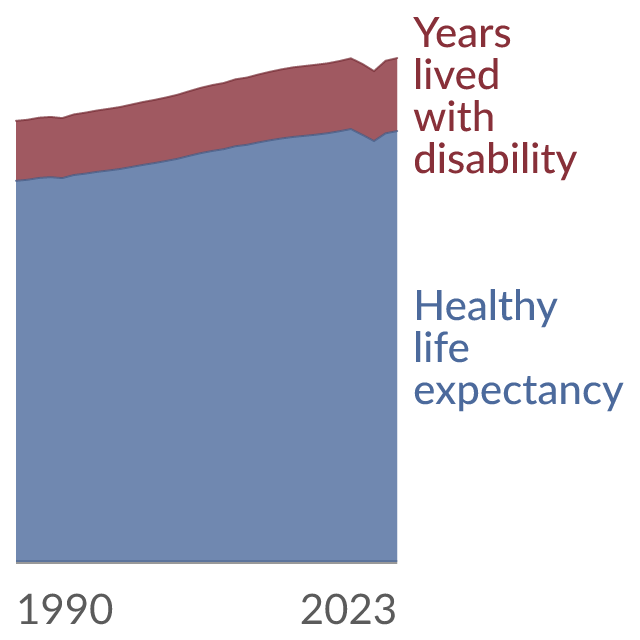
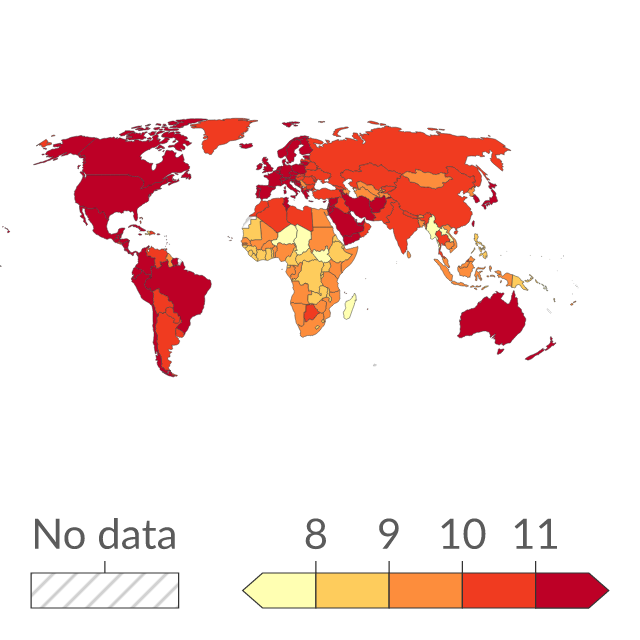
Preview of Healthy life expectancy
ChartOur World in Data

Healthy life expectancy

The estimated average number of years lived free from disability or disease burden. This is based on period life expectancy, after adjusting for the number of years lived in less than "full health" due to disease and/or injury.

Source
Our World in Data
Updated
22 May 2026
PreviewSubmitted image
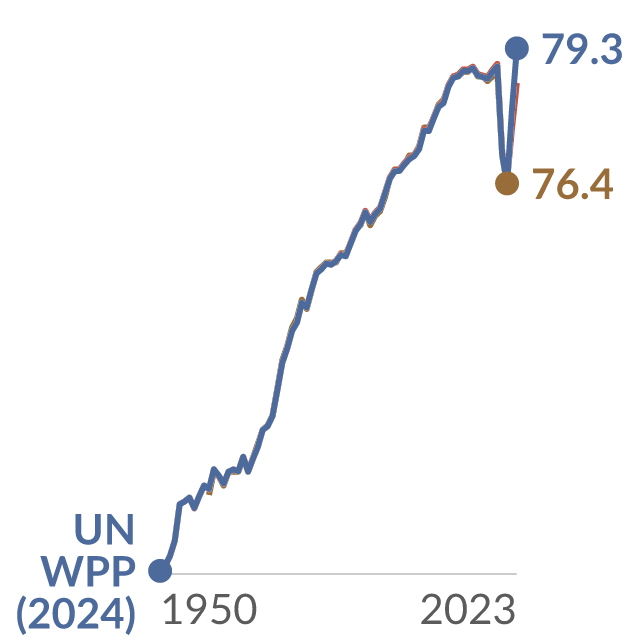
Preview of Life expectancy, source comparison
ChartOur World in Data

Life expectancy, source comparison

The period life expectancy at birth, in a given year. Estimates from three different sources are compared: the United Nations World Population Prospects (UN WPP), the Human Mortality Database (HMD) and the Organisation for Economic Co-operation and Development (OECD).

Source
Our World in Data
Updated
22 Oct 2025
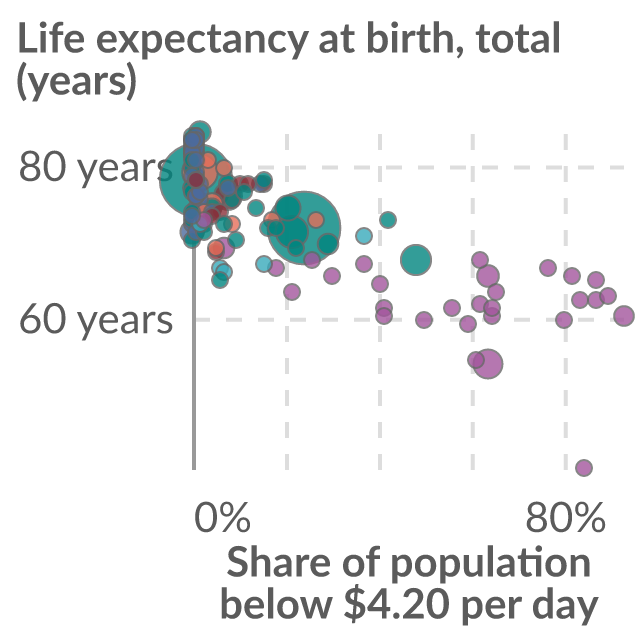
PreviewSubmitted image
Preview of Share in poverty vs. life expectancy
ChartOur World in Data

Share in poverty vs. life expectancy

The poverty line of $4.20 per day is set by the World Bank to be representative of the definitions of poverty adopted in lower-middle-income countries. Life expectancy is measured as the average number of years a newborn would live if age-specific mortality rates in the current year were to stay the same throughout its life.

Source
Our World in Data
Updated
26 Jun 2026
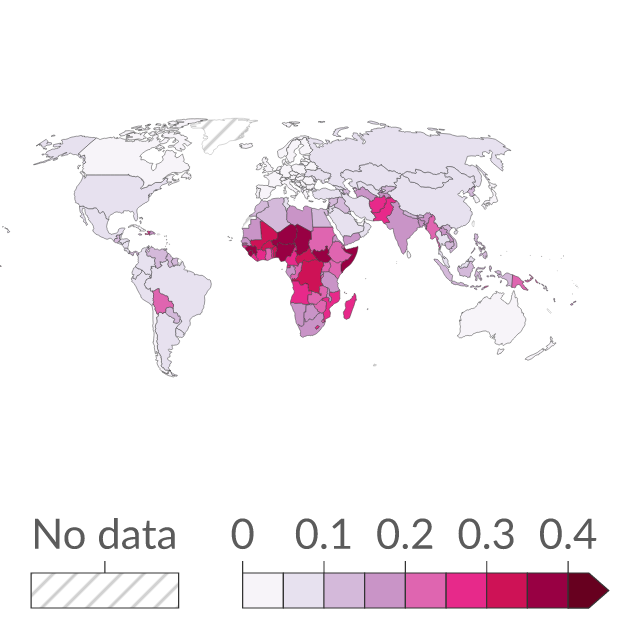
PreviewSubmitted image
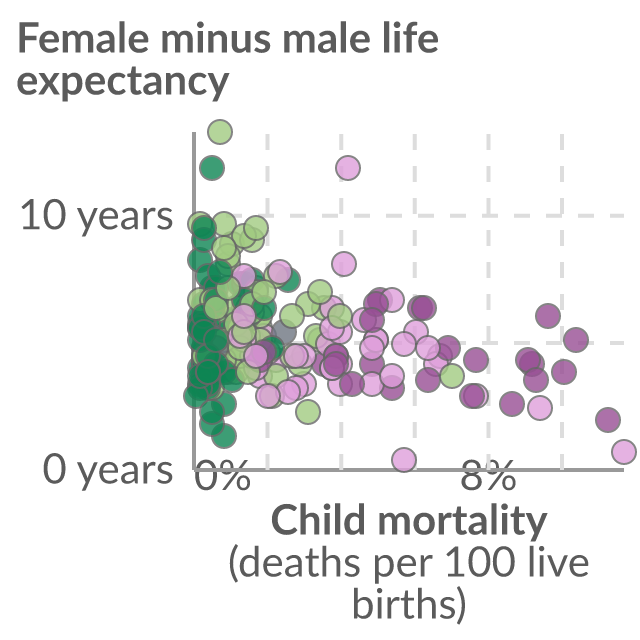
Preview of Inequality in life expectancy
ChartOur World in Data

Inequality in life expectancy

The Atkinson index measures inequality on a scale from 0 to 1. Higher values indicate higher inequality. Inequality is measured here in terms of the number of years a newborn would live if age-specific mortality rates in the current year were to stay the same throughout its life.

Source
Our World in Data
Updated
07 May 2025