
Data previewER.MRN.PTMR.ZS
Loading latest World Bank observations…
DatasetWorld Bank Open Data
Marine protected areas (% of territorial waters)
World Bank indicator ER.MRN.PTMR.ZS; latest fetched observation: 2025.
Where publishers find data.
Source links, freshness and reuse rights stay visible on every result.
World Bank indicator ER.MRN.PTMR.ZS; latest fetched observation: 2025.
| Time frequency | Categories of navigable inland waterways by horizontal dimensions of vessels and pushed convoys | Unit of measure | Geopolitical entity (reporting) | Time | Value |
|---|---|---|---|---|---|
| Annual | Total | Kilometre | European Union - 27 countries (from 2020) | 2022 | 50,385.25 |
| Annual | Total | Kilometre | European Union - 27 countries (from 2020) | 2023 | 50,541.85 |
| Annual | Total | Kilometre | European Union - 27 countries (from 2020) | 2024 | 50,425.95 |
Reviewed Eurostat observations; customised presentation, not an official Eurostat embed.
Eurostat dataset iww_if_hordim; Navigable inland waterways, by horizontal dimensions of vessels and pushed convoys; updated 2026-07-29T23:00:00+0200.
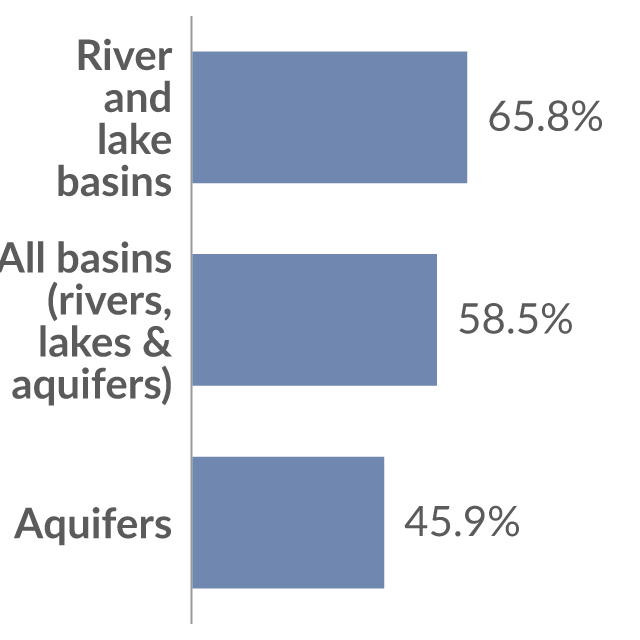
Share of transboundary basins area with an operational arrangement for water cooperation. This shows how much of the total internationally shared water resources are managed through active cooperation between countries, which helps prevent conflict and support sustainable use.
World Bank indicator SG.H2O.PRMS.HH.ZS; latest fetched observation: 2025.
| Time frequency | Standard goods classification for transport statistics (NST 2007, 20 group) | Transport coverage | Type of cargo | Unit of measure | Geopolitical entity (reporting) | Time | Value |
|---|---|---|---|---|---|---|---|
| Annual | Total transported goods | Total transport | Total | Thousand tonnes | European Union - 27 countries (from 2020) | 2023 | 397,223 |
| Annual | Total transported goods | Total transport | Total | Thousand tonnes | European Union - 27 countries (from 2020) | 2024 | 397,222 |
| Annual | Total transported goods | Total transport | Total | Thousand tonnes | European Union - 27 countries (from 2020) | 2025 | 393,039 |
| Annual | Total transported goods | Total transport | Total | Million tonne-kilometre (TKM) | European Union - 27 countries (from 2020) | 2023 | 101,400 |
Reviewed Eurostat observations; customised presentation, not an official Eurostat embed. Showing 4 of 50.
Eurostat dataset iww_go_atyca; Inland waterway transport by type of cargo, type of goods and coverage; updated 2026-07-28T23:00:00+0200.
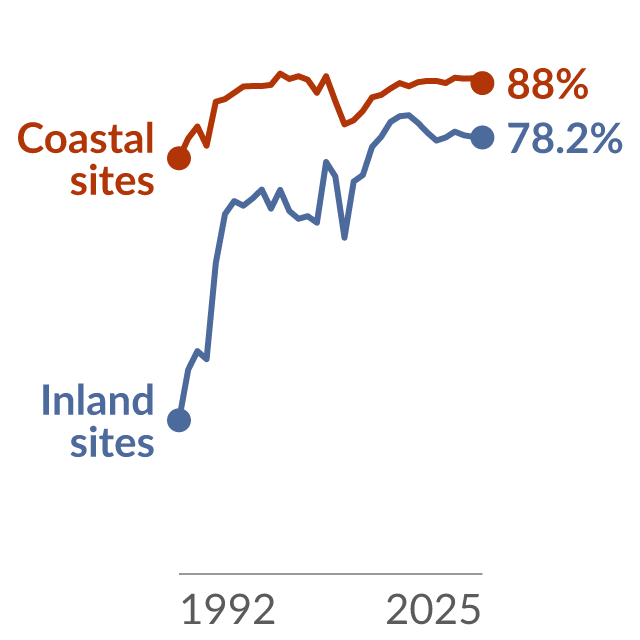
The percentage of coastal and inland bathing sites with 'excellent' water quality. Bathing sites classified as 'excellent' meet strict threshold for levels of bacteria that are associated with sewage pollution.
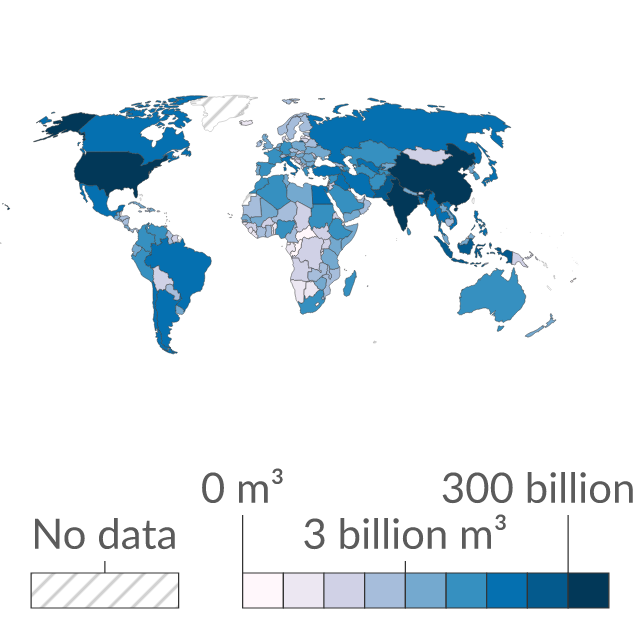
Annual freshwater withdrawals refer to total water withdrawals, not counting evaporation losses from storage basins, measured in cubic meters (m³) per year. Total water withdrawals are the sum of withdrawals for agriculture, industry and municipal (domestic uses). Withdrawals also include water from desalination plants in countries where they are a significant source.
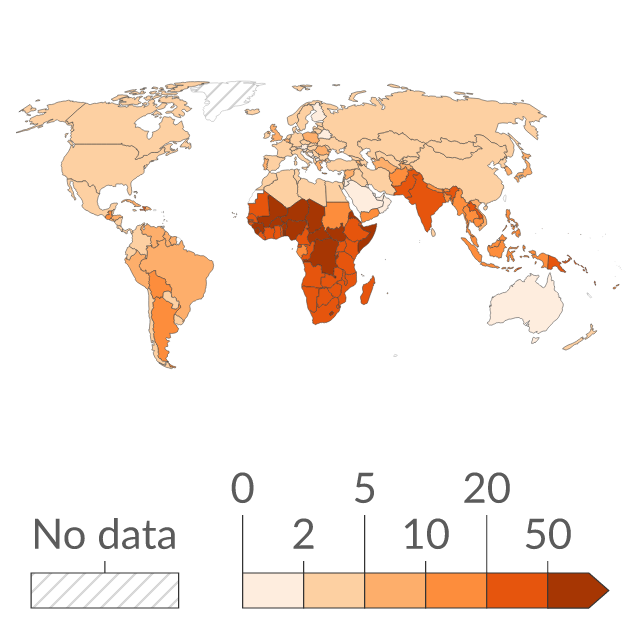
Death rate attributed to unsafe water, unsafe sanitation or lack of hygiene (WASH), measured as the number of deaths per 100,000 people of a given population.
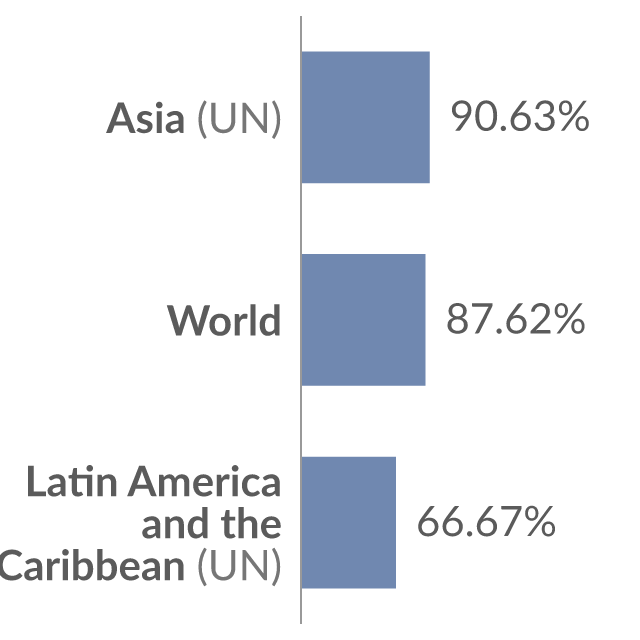
The share of countries in a given region with clearly defined procedures in law or policy for participation by service users/communities in planning programmes in water resources planning and management.
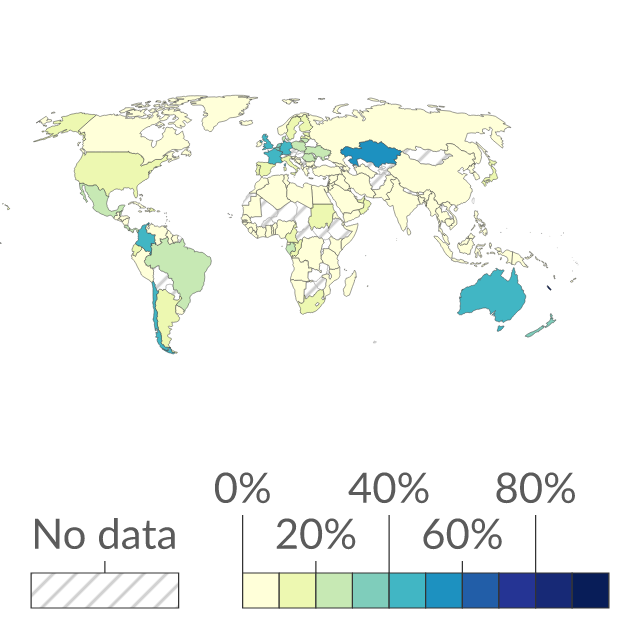
Marine protected areas are regions of intertidal or sub-tidal land and associated water, flora and fauna, and cultural and historical features that have been legally or effectively reserved for protection.
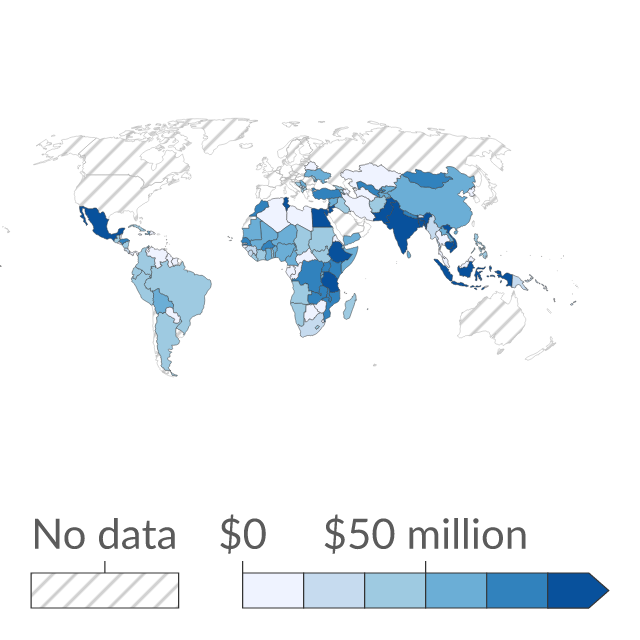
Total water and sanitation-related Official Development Assistance disbursements that are included in the government budget. This data is expressed in US dollars. It is adjusted for inflation but does not account for differences in living costs between countries.
World Bank indicator SH.H2O.SMDW.ZS; latest fetched observation: 2025.
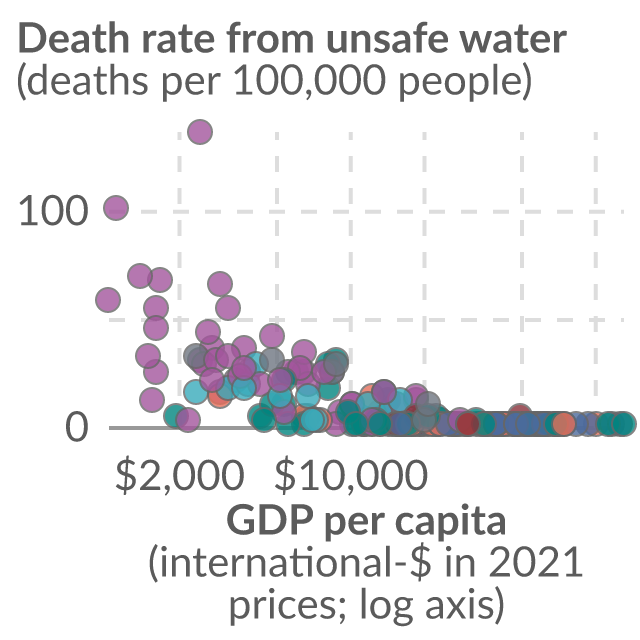
Estimated number of deaths attributed to unsafe water, per 100,000 individuals. GDP per capita is adjusted for inflation and differences in living costs between countries.
World Bank indicator IE.PPI.WATR.CD; latest fetched observation: 2025.
| Time frequency | Level | Nomenclature of land cover and land use (Corine Land Cover 2018) | Unit of measure | Geopolitical entity (reporting) | Time | Value | Flag |
|---|---|---|---|---|---|---|---|
| Annual | Severe | Agricultural areas, forest and semi natural areas (excluding beaches, dunes, sand plains, bare rock and glaciers and perpetual snow) | Square kilometre | European Union - 27 countries (from 2020) | 2023 | 190,086.87 | p |
| Annual | Severe | Agricultural areas, forest and semi natural areas (excluding beaches, dunes, sand plains, bare rock and glaciers and perpetual snow) | Percentage | European Union - 27 countries (from 2020) | 2023 | 5.11 | p |
Reviewed Eurostat observations; customised presentation, not an official Eurostat embed.
Eurostat dataset aei_pr_soiler; Estimated soil erosion by water, by erosion level, land cover and NUTS 3 region; updated 2026-03-19T23:00:00+0100.
| Time frequency | Irrigation methods | Water sources | Statistical information | Irrigation of agricultural area | Unit of measure | Geopolitical entity (reporting) | Time | Value |
|---|---|---|---|---|---|---|---|---|
| Annual | Total | Total | Above threshold | Irrigated utilised agricultural area | Hectare | European Union - 27 countries (from 2020) | 2023 | 9,987,360 |
| Annual | Total | Total | Above threshold | Irrigated utilised agricultural area | Holding | European Union - 27 countries (from 2020) | 2023 | 1,387,760 |
| Annual | Total | Total | Above threshold | Average irrigated utilised agricultural area - outdoor | Hectare | European Union - 27 countries (from 2020) | 2023 | 10,504,120 |
| Annual | Total | Total | Above threshold | Average irrigated utilised agricultural area - outdoor | Holding | European Union - 27 countries (from 2020) | 2023 | 1,277,240 |
Reviewed Eurostat observations; customised presentation, not an official Eurostat embed. Showing 4 of 50.
Eurostat dataset ef_mp_irri; Irrigation methods and source of irrigation water of agricultural holdings by NUTS 2 region; updated 2026-06-17T23:00:00+0200.
World Bank indicator IE.PPN.WATR.CD; latest fetched observation: 2025.
| Time frequency | Agricultural inputs | Expenditure and investment | Statistical information | Maintenance status | Unit of measure | Geopolitical entity (reporting) | Time | Value |
|---|---|---|---|---|---|---|---|---|
| Annual | Reservoirs | Total | Above threshold | Total | Hectare | European Union - 27 countries (from 2020) | 2023 | 3,500,410 |
| Annual | Reservoirs | Total | Above threshold | Total | Holding | European Union - 27 countries (from 2020) | 2023 | 465,800 |
| Annual | Reservoirs | Total | Above threshold | Maintenance to the irrigation system or distribution network - regular annual | Holding | European Union - 27 countries (from 2020) | 2023 | 263,410 |
| Annual | Reservoirs | Total | Above threshold | Maintenance to the irrigation system or distribution network - major repairs or rehabilitations | Hectare | European Union - 27 countries (from 2020) | 2023 | 579,060 |
Reviewed Eurostat observations; customised presentation, not an official Eurostat embed. Showing 4 of 50.
Eurostat dataset ef_mp_tpirri; Technical parameters of the irrigation equipment of agricultural holdings and payment terms for irrigation water by NUTS 2 region; updated 2026-06-17T23:00:00+0200.
| Time frequency | Unit of measure | Geopolitical entity (reporting) | Time | Value |
|---|---|---|---|---|
| Annual | Percentage of total | European Union - 27 countries (from 2020) | 2020 | 9.7 |
| Annual | Percentage of total | European Union - 27 countries (from 2020) | 2021 | 9.4 |
| Annual | Percentage of total | European Union - 27 countries (from 2020) | 2022 | 9.2 |
| Annual | Percentage of total | European Union - 27 countries (from 2020) | 2023 | 8.8 |
Reviewed Eurostat observations; customised presentation, not an official Eurostat embed. Showing 4 of 5.
Eurostat dataset tran_im_uiww; Unitisation in inland waterways freight transport - tonne-kilometre for gross-gross weight of goods; updated 2026-03-09T23:00:00+0100.
World Bank indicator SH.H2O.BASW.ZS; latest fetched observation: 2025.
World Bank indicator SG.H2O.TM30.HH.ZS; latest fetched observation: 2025.
World Bank indicator SG.H2O.TL30.HH.ZS; latest fetched observation: 2025.
World Bank indicator ER.H2O.FWST.ZS; latest fetched observation: 2025.
World Bank indicator SH.STA.WASH.P5; latest fetched observation: 2025.