Where publishers find data.

Results for “agriculture”

Source links, freshness and reuse rights stay visible on every result.

Page 8 · 24 results
Filters
FiltersClear
Asset type
Source
Commercial use
Rights review
Freshness
Data previewef_mp_tpirri
Reviewed data preview from ef_mp_tpirri
Time frequencyAgricultural inputsExpenditure and investmentStatistical informationMaintenance statusUnit of measureGeopolitical entity (reporting)TimeValue
AnnualReservoirsTotalAbove thresholdTotalHectareEuropean Union - 27 countries (from 2020)20233,500,410
AnnualReservoirsTotalAbove thresholdTotalHoldingEuropean Union - 27 countries (from 2020)2023465,800
AnnualReservoirsTotalAbove thresholdMaintenance to the irrigation system or distribution network - regular annualHoldingEuropean Union - 27 countries (from 2020)2023263,410
AnnualReservoirsTotalAbove thresholdMaintenance to the irrigation system or distribution network - major repairs or rehabilitationsHectareEuropean Union - 27 countries (from 2020)2023579,060

Reviewed Eurostat observations; customised presentation, not an official Eurostat embed. Showing 4 of 50.

DatasetEurostat

Technical parameters of the irrigation equipment of agricultural holdings and payment terms for irrigation water by NUTS 2 region

Eurostat dataset ef_mp_tpirri; Technical parameters of the irrigation equipment of agricultural holdings and payment terms for irrigation water by NUTS 2 region; updated 2026-06-17T23:00:00+0200.
Source
Eurostat
Updated
17 Jun 2026
Data previewef_mp_ma
Reviewed data preview from ef_mp_ma
Time frequencySize classes of total livestock units (LSU)Agricultural inputsManure storage and applicationStatistical informationFarm typeUnit of measureGeopolitical entity (reporting)TimeValue
AnnualTotalTotalTotalAbove thresholdTotalHectareEuropean Union - 27 countries (from 2020)202095,706,550
AnnualTotalTotalTotalAbove thresholdTotalHoldingEuropean Union - 27 countries (from 2020)20205,014,320
AnnualTotalTotalTotalAbove thresholdSpecialist field cropsHectareEuropean Union - 27 countries (from 2020)202033,492,570
AnnualTotalTotalTotalAbove thresholdSpecialist field cropsHoldingEuropean Union - 27 countries (from 2020)20201,572,580

Reviewed Eurostat observations; customised presentation, not an official Eurostat embed. Showing 4 of 50.

DatasetEurostat

Utilised agricultural area fertilised by manure application technique, farm type and NUTS 2 region

Eurostat dataset ef_mp_ma; Utilised agricultural area fertilised by manure application technique, farm type and NUTS 2 region; updated 2026-06-17T23:00:00+0200.
Source
Eurostat
Updated
17 Jun 2026
PreviewSubmitted image
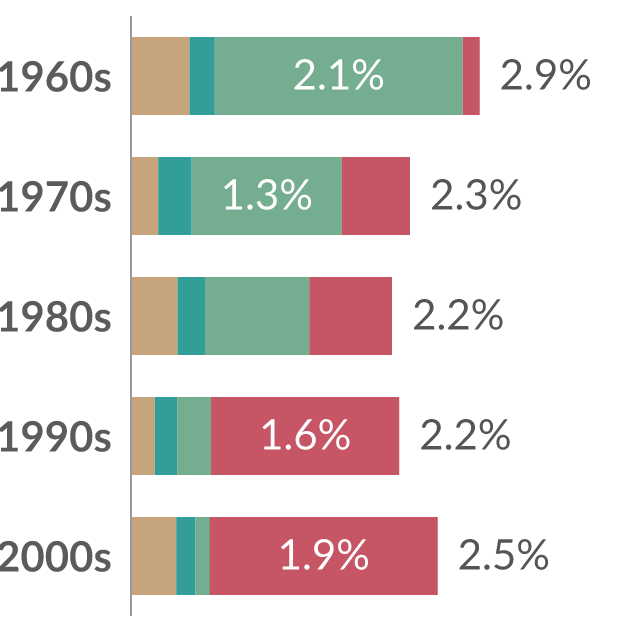
Preview of What has driven the growth in global agricultural production?
ChartOur World in Data

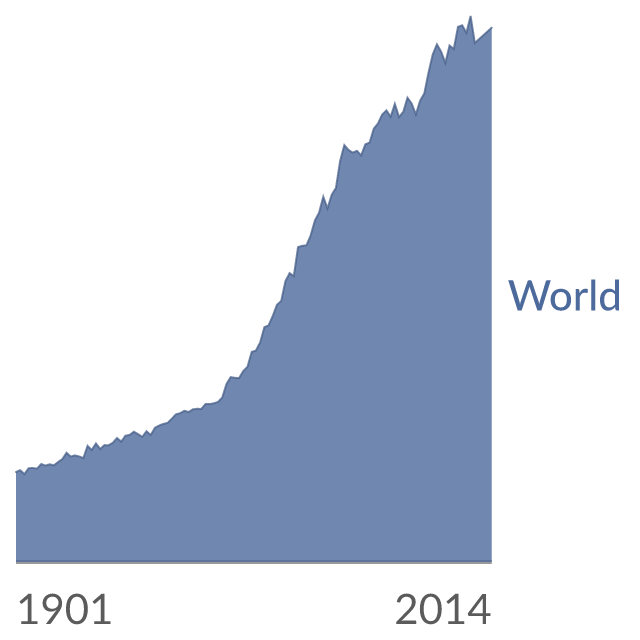
What has driven the growth in global agricultural production?

Global agricultural growth is measured by the average annual change in economic output from agriculture. This is broken down by its drivers in each decade. Productivity growth measures increase output from a given amount of input: it's driven by factors such as efficiency gains, better seed varieties, land reforms, and better management practices.

Source
Our World in Data
Updated
01 Jun 2021