
PreviewSubmitted image
ChartOur World in Data
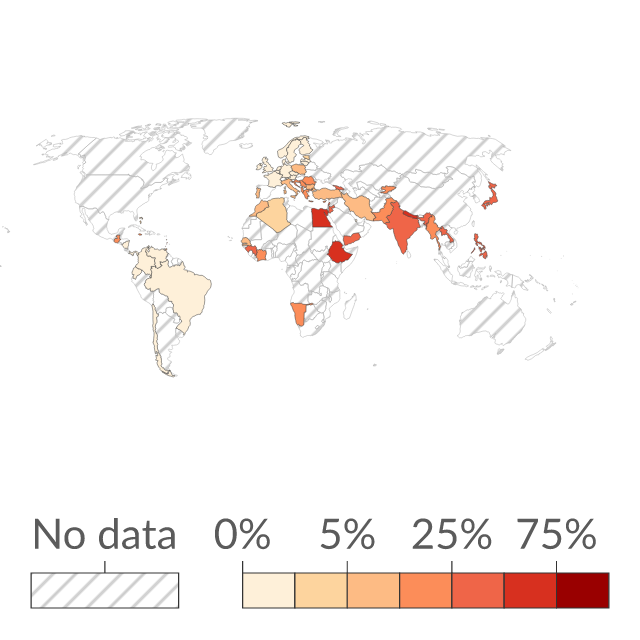
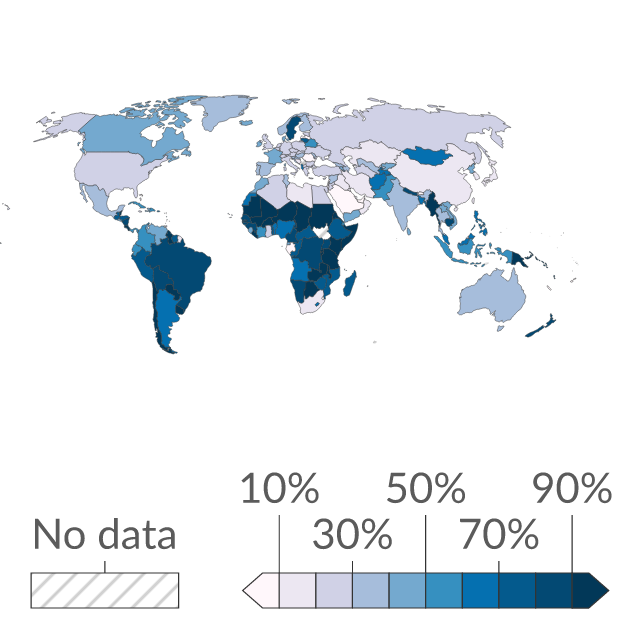
Share of agricultural land operated as smallholder farms
Smallholder farms are typically defined as being less than 2 hectares.
Where publishers find data.
Source links, freshness and reuse rights stay visible on every result.
Smallholder farms are typically defined as being less than 2 hectares.
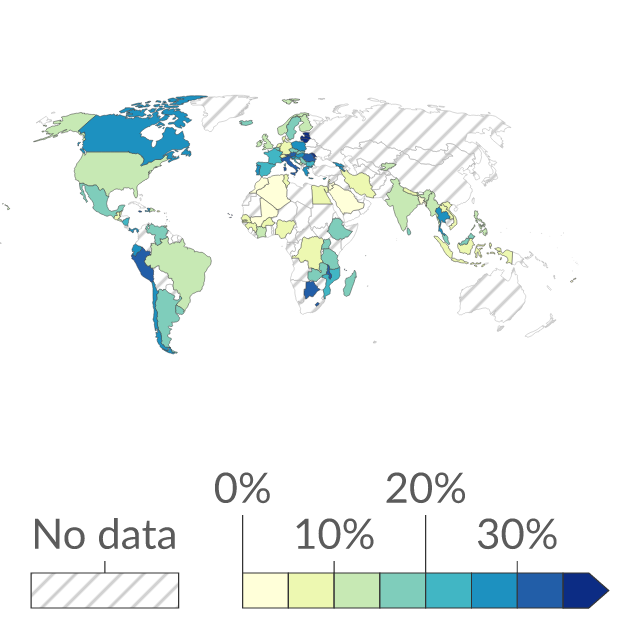
Landowners are defined as those that own land solely or jointly with someone inside or outside the household.
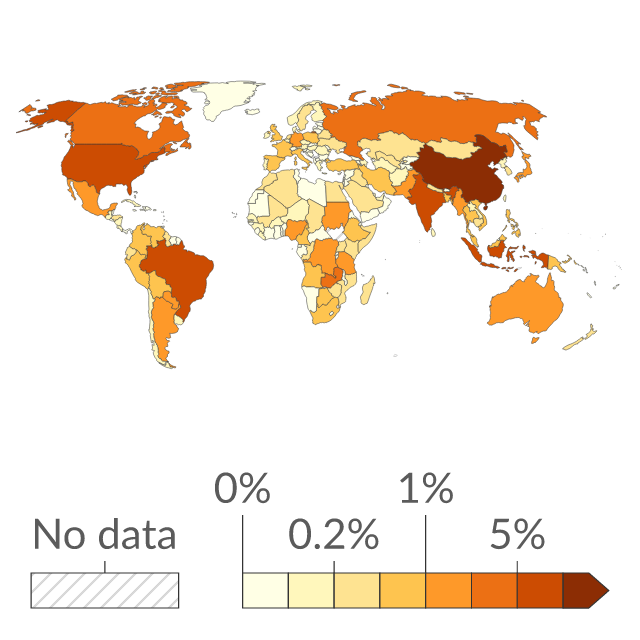
Food system emissions include agriculture, land-use change, and supply chain emissions (transport, packaging, food processing, retail, cooking, and waste). Emissions are quantified based on food production, not consumption. This means they do not account for international trade.
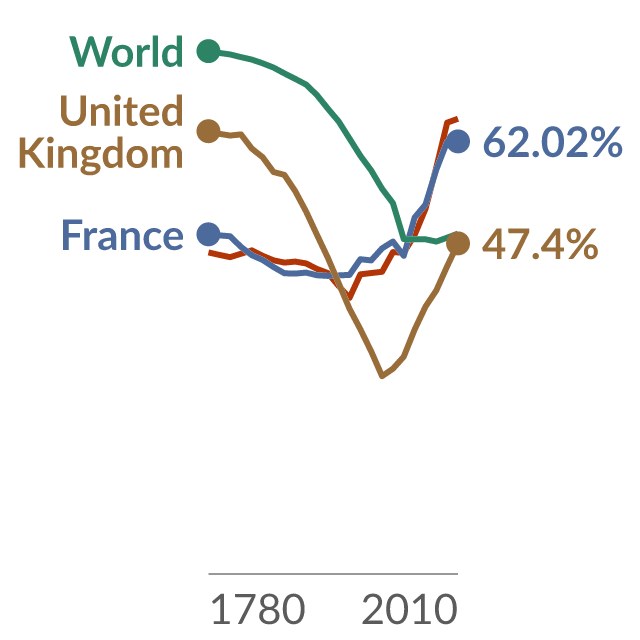
Natural ecosystems include forest, grassland, savanna, and shrublands, and other classes such as peatlands and marshes. It is total land minus land that is used by humans for agriculture – either croplands or pasture – or for infrastructure and urban environments.
Food system emissions include agriculture, land-use change, and supply chain emissions (transport, packaging, food processing, retail, cooking, and waste). Emissions are quantified based on food production, not consumption. This means they do not account for international trade.
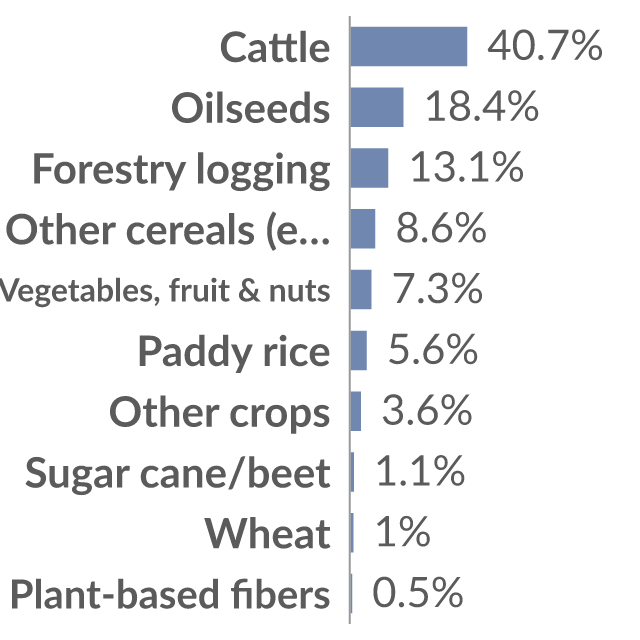
This is measured as the average over the period from 2010 to 2014.
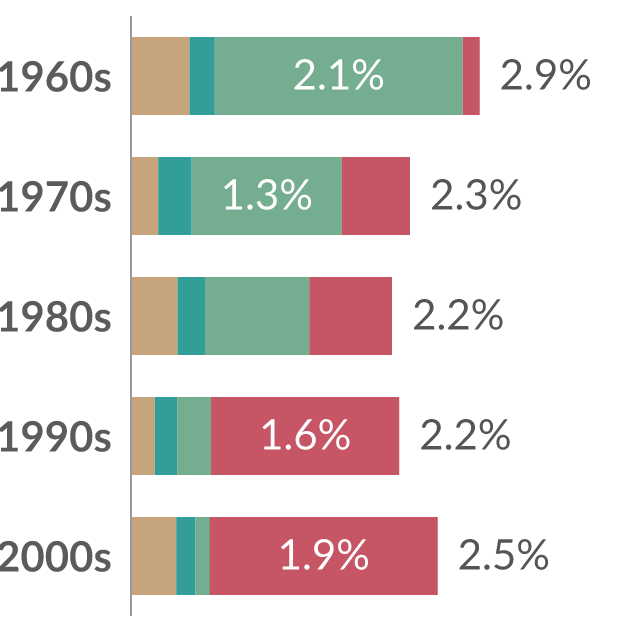
Global agricultural growth is measured by the average annual change in economic output from agriculture. This is broken down by its drivers in each decade. Productivity growth measures increase output from a given amount of input: it's driven by factors such as efficiency gains, better seed varieties, land reforms, and better management practices.
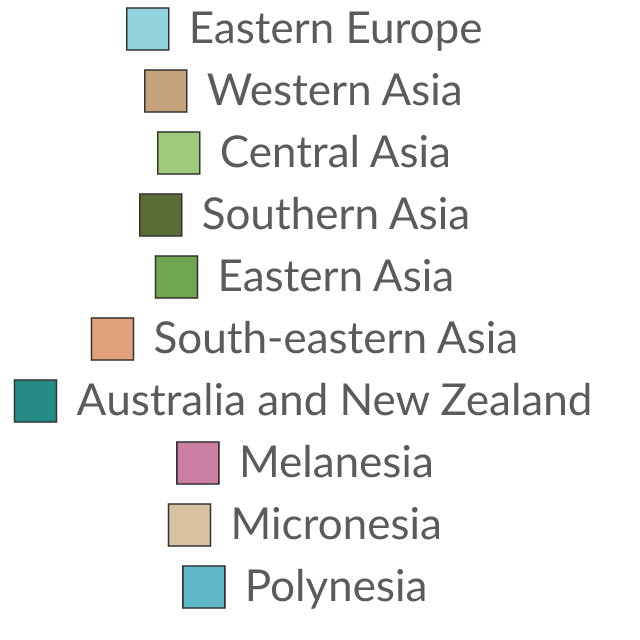
The Food and Agriculture Organization of the United Nations groups countries into these subregions. In some of its datasets, it groups them into continents.
World Bank indicator AG.LND.AGRI.ZS; latest fetched observation: 2025.
World Bank indicator AG.LND.AGRI.K2; latest fetched observation: 2025.
World Bank indicator TX.VAL.AGRI.ZS.UN; latest fetched observation: 2025.
World Bank indicator TM.VAL.AGRI.ZS.UN; latest fetched observation: 2025.
World Bank indicator SG.COK.CROP.ZS; latest fetched observation: 2025.
World Bank indicator FIN43C; latest fetched observation: 2025.
World Bank indicator FIN43C.2; latest fetched observation: 2025.
World Bank indicator FIN43C.1; latest fetched observation: 2025.
World Bank indicator FIN42; latest fetched observation: 2025.
World Bank indicator FIN42.2; latest fetched observation: 2025.
World Bank indicator FIN42.1; latest fetched observation: 2025.
| Time frequency | Agricultural indicator | Unit of measure | Geopolitical entity (reporting) | Time | Value |
|---|---|---|---|---|---|
| Annual | High-input farms | Hectare | European Union - 27 countries (from 2020) | 2020 | 53,194,843 |
| Annual | High-input farms | Hectare | European Union - 27 countries (from 2020) | 2021 | 48,914,392 |
| Annual | High-input farms | Percentage of area | European Union - 27 countries (from 2020) | 2020 | 37.5 |
| Annual | High-input farms | Percentage of area | European Union - 27 countries (from 2020) | 2021 | 34.4 |
Reviewed Eurostat observations; customised presentation, not an official Eurostat embed. Showing 4 of 12.
Eurostat dataset aei_ps_inp; Utilised agricultural area (UAA) managed by low-, medium- and high-input farms; updated 2024-01-10T11:00:00+0100.