Where publishers find data.

Results for “calculator”

Source links, freshness and reuse rights stay visible on every result.

Page 2 · 18 results
Filters
FiltersClear
Asset type
Source
Commercial use
Rights review
Freshness
PreviewSubmitted image
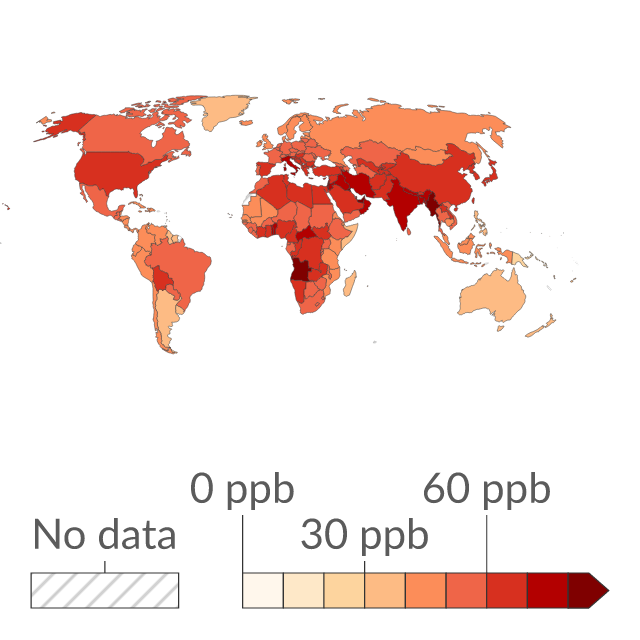
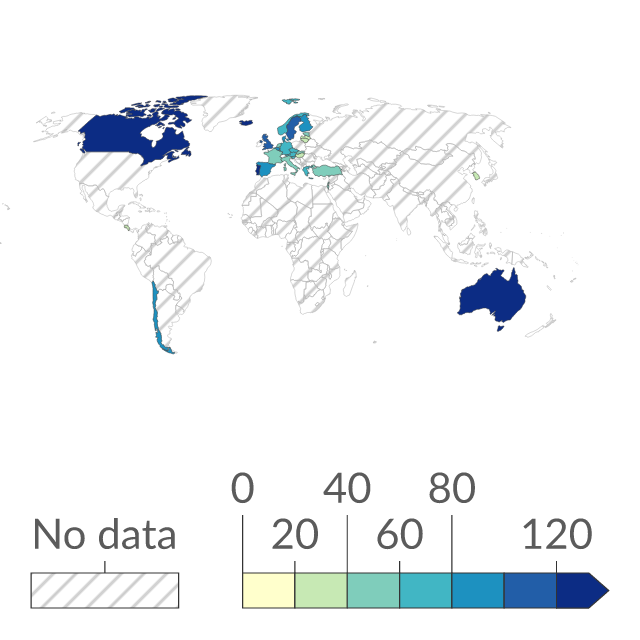
Preview of Ozone (O₃) concentration
ChartOur World in Data

Ozone (O₃) concentration

Population-weighted average ozone (O₃) concentrations in parts per billion (ppb). Local concentrations of ozone are recorded and estimated at a 11x11km resolution. These values are subsequently weighted by population-density for calculation of nation-level average concentrations.
Source
Our World in Data
Updated
04 Dec 2017
PreviewSubmitted image
Preview of Numeracy rate in men
ChartOur World in Data

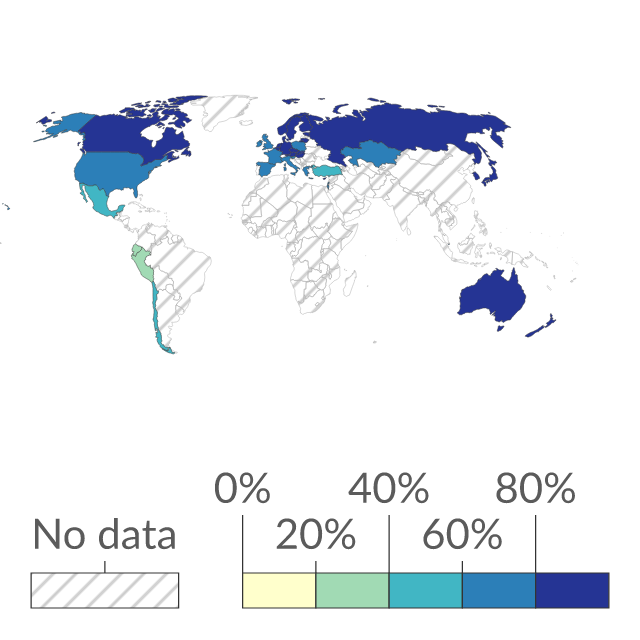
Numeracy rate in men

Share of men aged 16-65 years who can apply multiple steps involving calculation with common decimals, percentages, and fractions; simple measurement and spatial representation; and interpretation of relatively simple data and statistics in texts, tables, and graphs.

Source
Our World in Data
Updated
29 Oct 2025
PreviewSubmitted image
Preview of Numeracy rate in women
ChartOur World in Data

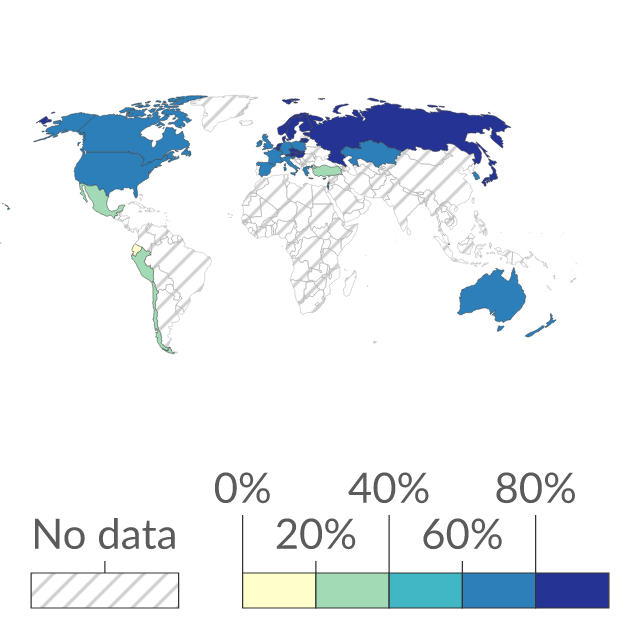
Numeracy rate in women

Share of women aged 16-65 years who can apply multiple steps involving calculation with common decimals, percentages, and fractions; simple measurement and spatial representation; and interpretation of relatively simple data and statistics in texts, tables, and graphs.

Source
Our World in Data
Updated
29 Oct 2025
PreviewSubmitted image
Preview of Urban area over the long-term
ChartOur World in Data

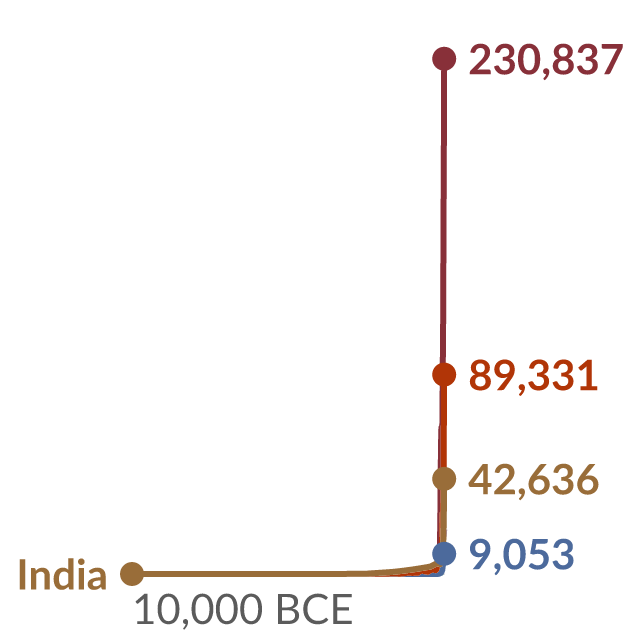
Urban area over the long-term

Estimated urban area by region or country, measured in square kilometers (km²) is calculated by dividing the total urban population of a country in a given year by the average urban densities in that country during the same year.

Source
Our World in Data
Updated
08 Jun 2026
PreviewSubmitted image
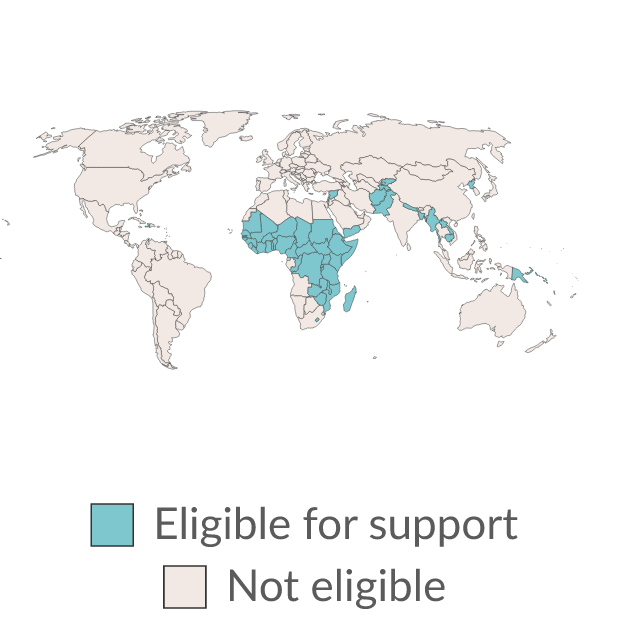
Preview of Gavi supported countries
ChartOur World in Data

Gavi supported countries

Gavi provides financial and expert knowledge support for countries to access new and underused vaccines. Support is given to countries with a Gross National Income per capita of less than US$1,810, calculated using the World Bank Atlas Method, over the past three years.

Source
Our World in Data
Updated
11 Feb 2025
PreviewSubmitted image
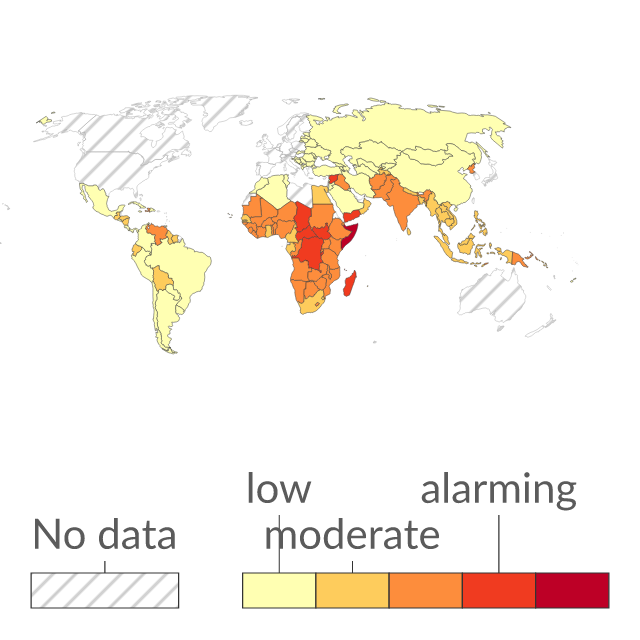
Preview of Global Hunger Index
ChartOur World in Data

Global Hunger Index

The Global Hunger Index tries to capture the multidimensional nature of hunger by calculating an index score from four key hunger indicators. It is measured on a 100-point scale where 0 is the best score (no hunger) and 100 is the worst.

Source
Our World in Data
Updated
24 Feb 2022
PreviewSubmitted image
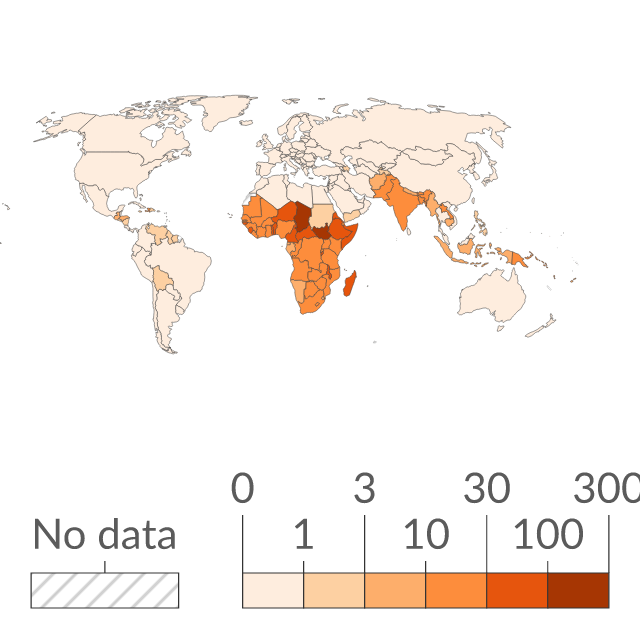
Preview of Death rate from unsafe sanitation
ChartOur World in Data

Death rate from unsafe sanitation

Estimated annual number of deaths attributed to unsafe sanitation per 100,000 people. This is calculated as the 'attributable burden'. Attributable burden represents the reduction in deaths if a population's exposure had shifted from unsafe to adequate sanitation facilities.

Source
Our World in Data
Updated
07 Feb 2026
PreviewSubmitted image
Preview of Poverty gap index at $3 a day
ChartOur World in Data

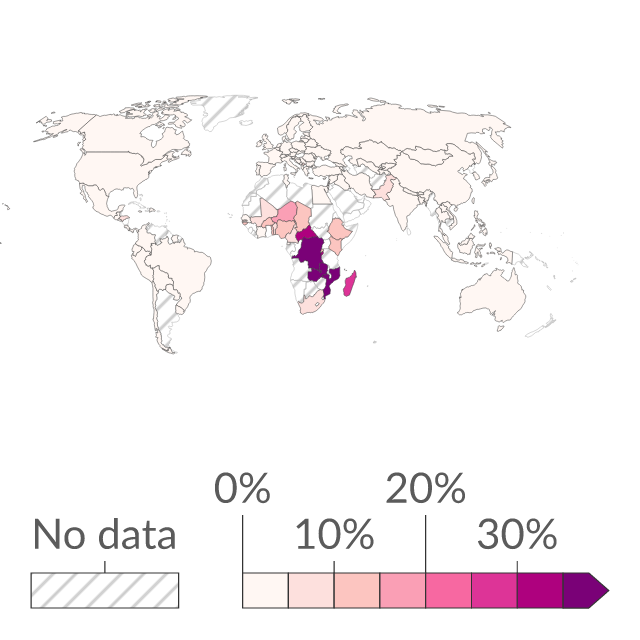
Poverty gap index at $3 a day

The poverty gap index is a poverty measure that reflects both the prevalence and the depth of poverty. It is calculated as the share of population in poverty multiplied by the average shortfall from the poverty line (expressed as a % of the poverty line).

Source
Our World in Data
Updated
26 Jun 2026
PreviewSubmitted image
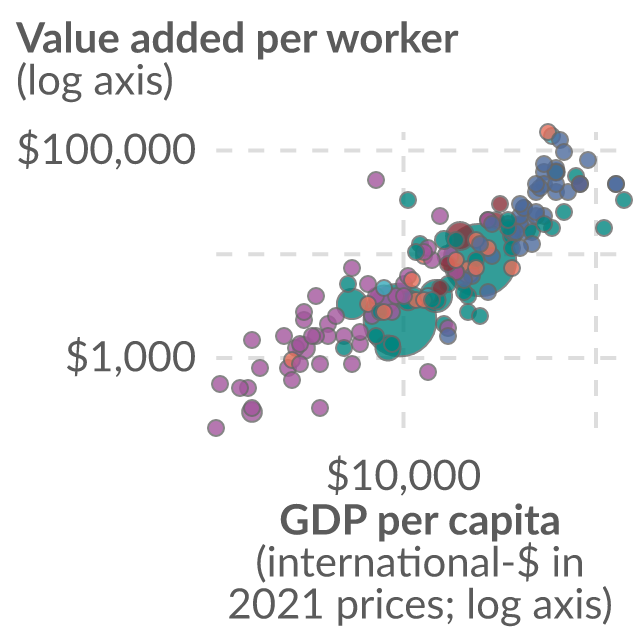
Preview of Agricultural value added per worker
ChartOur World in Data

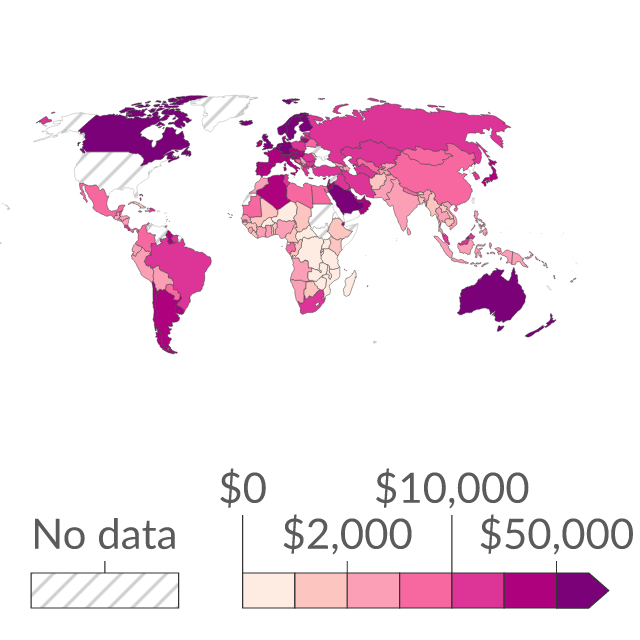
Agricultural value added per worker

Agricultural value added per worker is calculated by dividing the amount of economic value generated from farming, forestry and fishing by the number of people who work in these sectors. This data is expressed in US dollars. It is adjusted for inflation but does not account for differences in living costs between countries.

Source
Our World in Data
Updated
27 Jul 2026
PreviewSubmitted image
Preview of Annual growth of the income or consumption of the poorest 40% vs. the total population
ChartOur World in Data

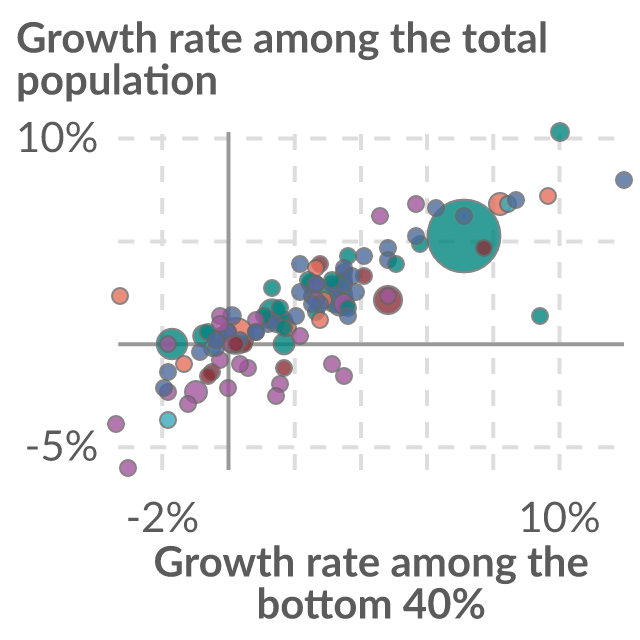
Annual growth of the income or consumption of the poorest 40% vs. the total population

The growth rate is calculated between two household surveys – the most recent survey available in 2024 and a survey falling approximately five years earlier. In countries below the dotted line, income or consumption growth is higher for the poorest 40% of the population than the national average.

Source
Our World in Data
Updated
31 Jul 2026
PreviewSubmitted image
Preview of Arable land needed to produce a fixed quantity of crops
ChartOur World in Data

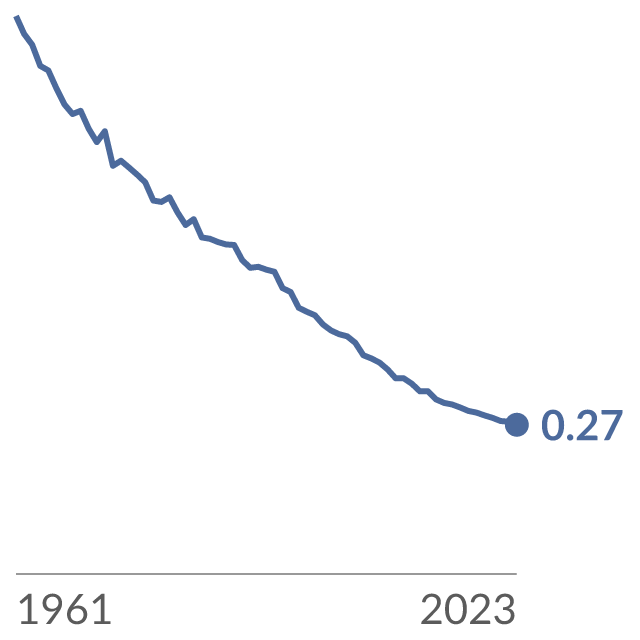
Arable land needed to produce a fixed quantity of crops

Arable land needed to produce a fixed quantity of crops is calculated as arable land divided by the crop production index (PIN). The crop production index (PIN) here is the sum of crop commodities (minus crops used for animal feed), weighted by commodity prices. This is measured as an index relative to 1961 (where 1961 = 1).

Source
Our World in Data
Updated
22 May 2026
PreviewSubmitted image
Preview of Share of population living in extreme poverty
ChartOur World in Data

Share of population living in extreme poverty

This data is calculated based on a ‘cost of basic needs’ approach. It represents the share of the population unable to meet basic needs (including minimal nutrition and adequately heated shelter) according to prices of locally-available goods and services at the time.

Source
Our World in Data
Updated
09 Oct 2023
PreviewSubmitted image
Preview of Gap in GDP per hour worked with respect to the United States
ChartOur World in Data

Gap in GDP per hour worked with respect to the United States

Figure illustrates the gap in GDP per hour worked with respect to the United States. The gap is calculated by taking a country's GDP per hour worked minus that of the US, divided by US GDP per hour worked. A positive gap suggests the country is more productive (has higher GDP per hour worked) than the US.

Source
Our World in Data
Updated
16 Mar 2018