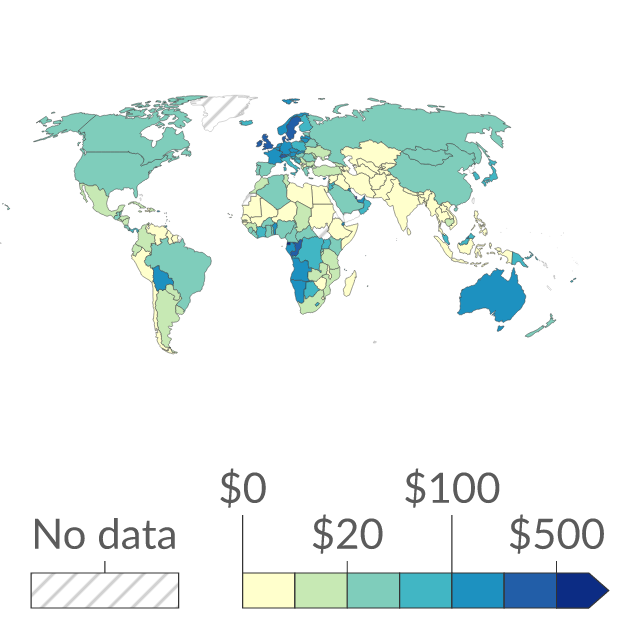
Water productivity, GDP per cubic meter of freshwater withdrawal
Water productivity is calculated as total gross domestic product (GDP), measured in constant 2015 US$ divided by annual total water withdrawal.
Where publishers find data.
Source links, freshness and reuse rights stay visible on every result.
Water productivity is calculated as total gross domestic product (GDP), measured in constant 2015 US$ divided by annual total water withdrawal.
| Time frequency | Unit of measure | Geopolitical entity (reporting) | Water process | Time | Value |
|---|---|---|---|---|---|
| Not applicable | Million cubic metres | European Union - 27 countries (from 2020) | Precipitation | 9999 | 3,283,772.8 |
| Not applicable | Million cubic metres | European Union - 27 countries (from 2020) | Internal flow | 9999 | 1,287,822.59 |
| Not applicable | Cubic metres per inhabitant | European Union - 27 countries (from 2020) | Precipitation | 9999 | 7,296.16 |
| Not applicable | Cubic metres per inhabitant | European Union - 27 countries (from 2020) | Internal flow | 9999 | 2,861.39 |
Reviewed Eurostat observations; customised presentation, not an official Eurostat embed.
Eurostat dataset ten00001; Water resources: long-term annual average; updated 2026-07-03T23:00:00+0200.
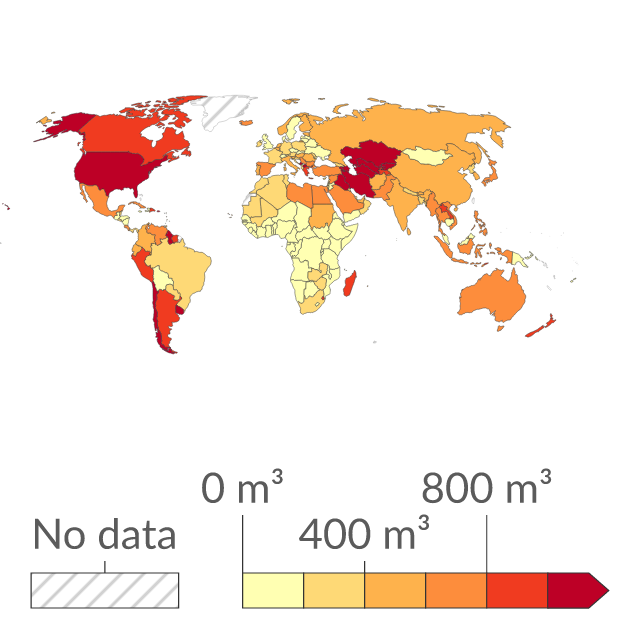
Total water withdrawals from agricultural, industrial and municipal purposes per capita, measured in cubic meters (m³) per year.
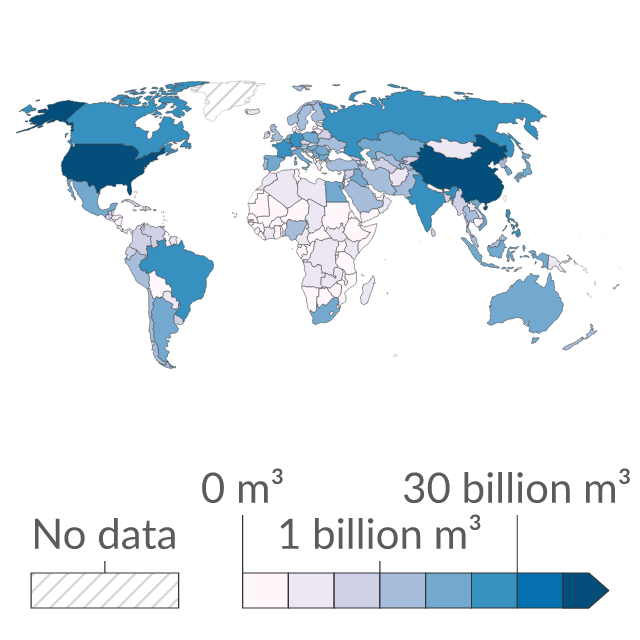
This measures the annual quantity of self-supplied water withdrawn for industrial uses, in cubic meters (m³) per year. It includes water for the cooling of thermoelectric and nuclear power plants, but it does not include hydropower. Water withdrawn by industries that are connected to the public supply network is generally included in municipal water withdrawal.
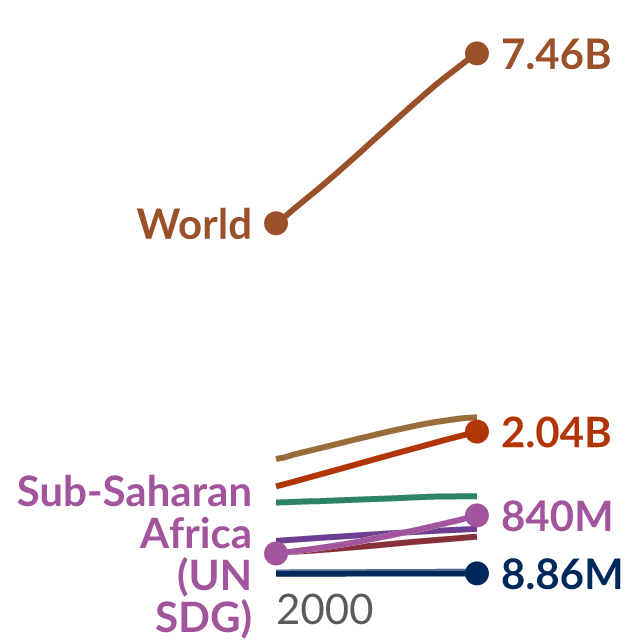
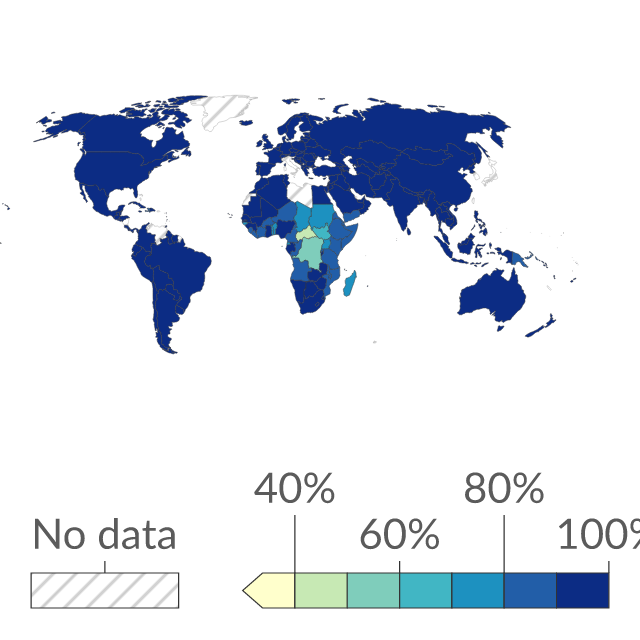
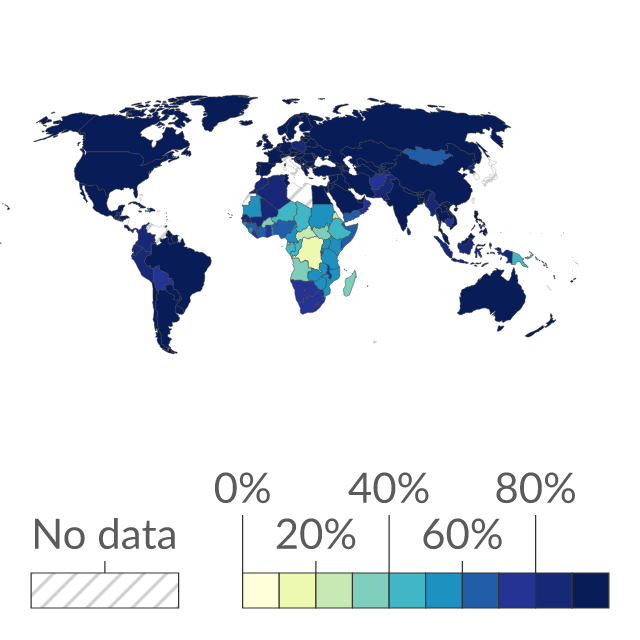
Safely managed drinking water facilities are improved drinking water sources that are located on premises, available when needed, and free from microbiological and priority chemical contamination.
A safely managed drinking water source is an improved water source that is located on premises, available when needed and free from contamination.
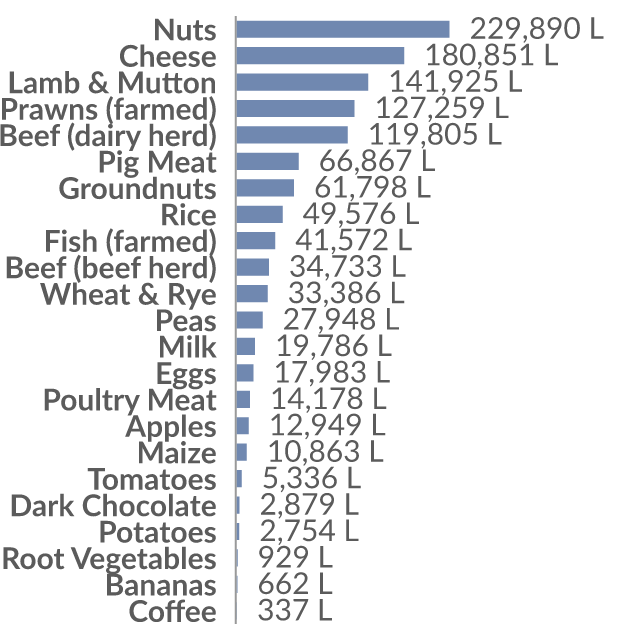
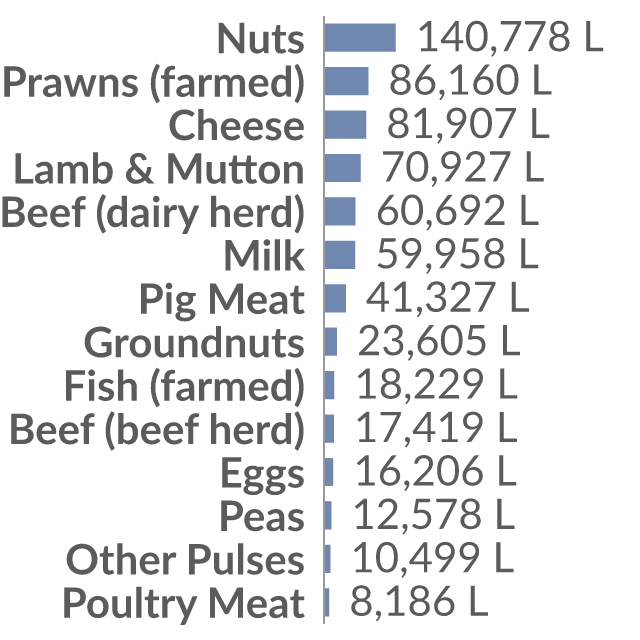
Scarcity-weighted water use represents freshwater use weighted by local water scarcity. This is measured in liters per kilogram of food product.
| Time frequency | Unit of measure | Aquatic environment | Geopolitical entity (reporting) | Time | Value |
|---|---|---|---|---|---|
| Annual | Number | Coastal water | European Union - 27 countries (from 2020) | 2020 | 14,361 |
| Annual | Number | Coastal water | European Union - 27 countries (from 2020) | 2021 | 14,471 |
| Annual | Number | Coastal water | European Union - 27 countries (from 2020) | 2022 | 14,519 |
| Annual | Number | Coastal water | European Union - 27 countries (from 2020) | 2023 | 14,585 |
Reviewed Eurostat observations; customised presentation, not an official Eurostat embed. Showing 4 of 36.
Eurostat dataset sdg_14_40; Bathing waters with excellent quality by location; updated 2026-09-08T23:00:00+0200.
Average scarcity-weighted water use represents freshwater use weighted by local water scarcity. This is measured in liters per 100 grams of protein.
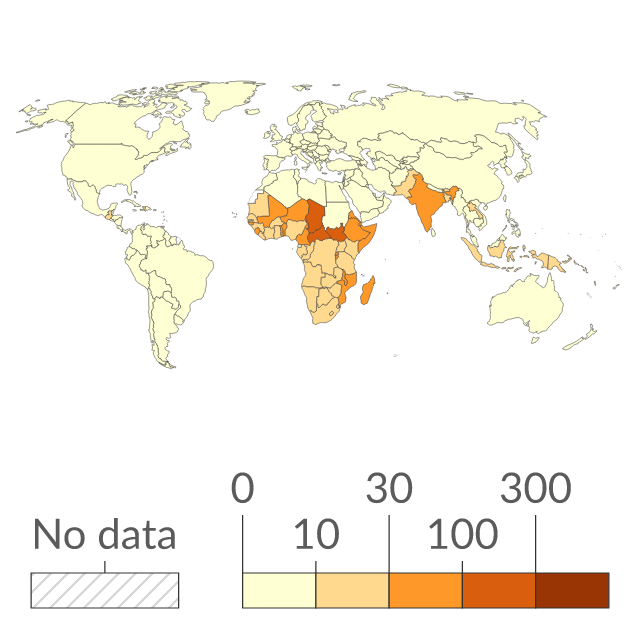
Estimated annual number of deaths attributed to unsafe water sources per 100,000 people.
Basic access to drinking water is defined as an improved drinking water source, provided collection time is not more than 30 minutes for a roundtrip including queuing.
Basic drinking water services are defined as an improved drinking water source where the collection time is not more than 30 minutes for a roundtrip, including queuing.
Basic drinking water services are defined as an improved drinking water source, provided collection time is not more than 30 minutes for a roundtrip including queuing.
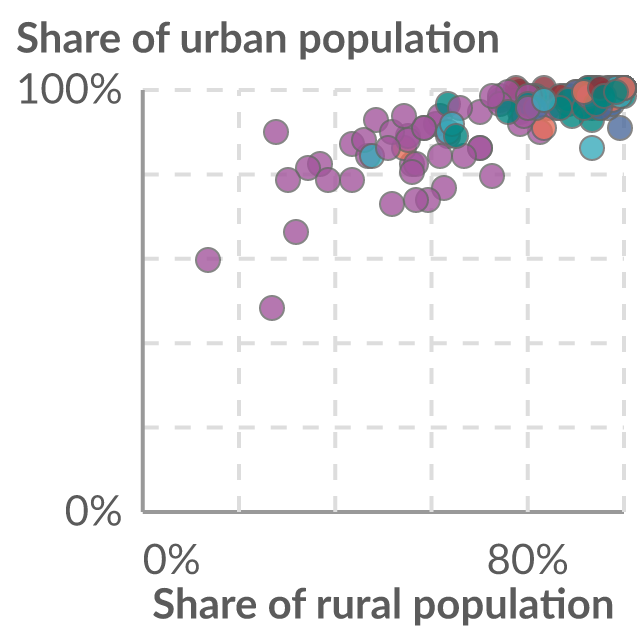
Share of urban versus rural population using at least a basic drinking water source; that is, an improved source within 30 minutes round trip to collect water.
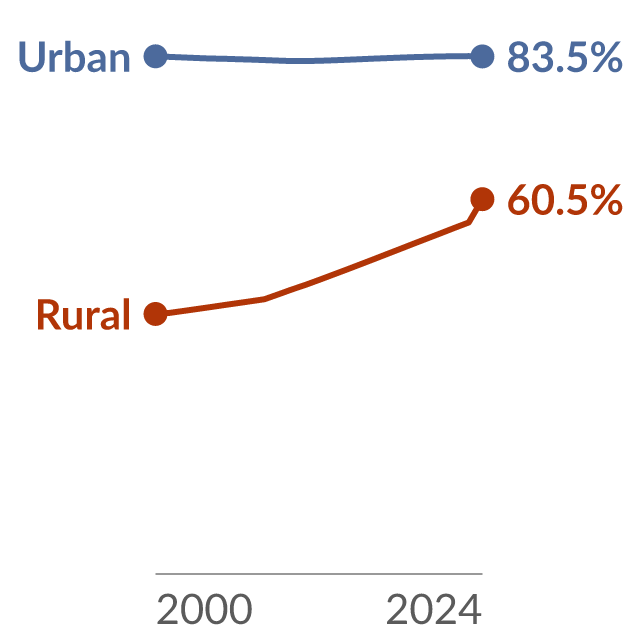
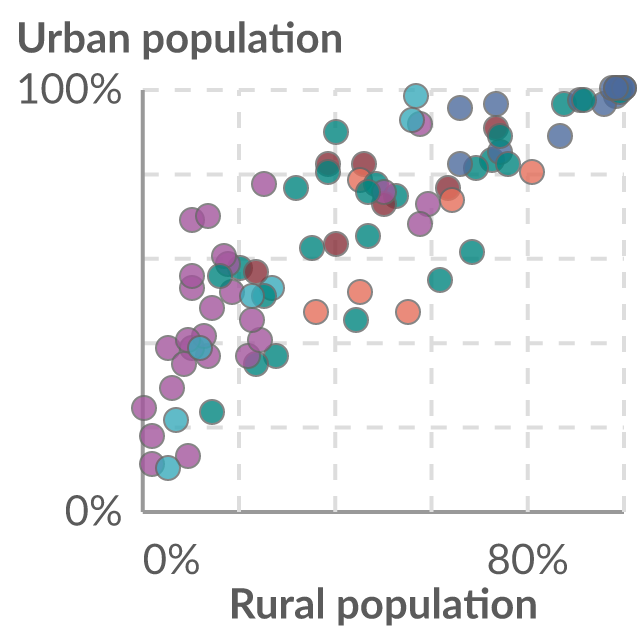
Share of population using safely managed drinking water in urban vs. rural areas. A safely managed drinking water source is located on premises, available when needed and free from contamination.
| Time frequency | Unit of measure | Nationality of registration of vessel | Transport coverage | Geopolitical entity (reporting) | Time | Value |
|---|---|---|---|---|---|---|
| Annual | Thousand tonnes | Belgium | Total transport | European Union - 27 countries (from 2020) | 2020 | 55,883 |
| Annual | Thousand tonnes | Belgium | Total transport | European Union - 27 countries (from 2020) | 2021 | 59,201 |
| Annual | Thousand tonnes | Belgium | Total transport | European Union - 27 countries (from 2020) | 2022 | 57,319 |
| Annual | Thousand tonnes | Belgium | National transport | European Union - 27 countries (from 2020) | 2020 | 27,048 |
Reviewed Eurostat observations; customised presentation, not an official Eurostat embed. Showing 4 of 50.
Eurostat dataset iww_go_anave; Inland waterway transport by nationality of vessel and coverage; updated 2026-07-28T23:00:00+0200.
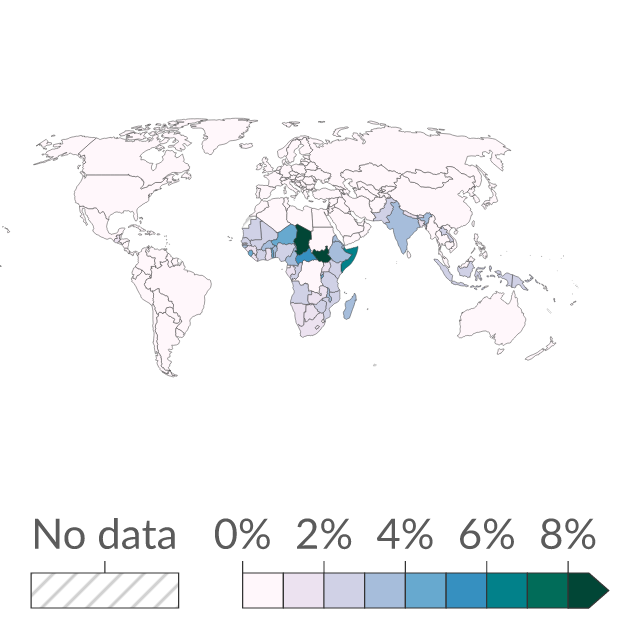
The share of total deaths, from any cause, with unsafe water sources as an attributed risk factor.
| Time frequency | Level | Nomenclature of land cover and land use (Corine Land Cover 2018) | Unit of measure | Geopolitical entity (reporting) | Time | Value | Flag |
|---|---|---|---|---|---|---|---|
| Annual | Severe | Agricultural areas, forest and semi natural areas (excluding beaches, dunes, sand plains, bare rock and glaciers and perpetual snow) | Percentage | European Union - 27 countries (from 2020) | 2023 | 5.11 | p |
| Annual | Severe | Agricultural areas, forest and semi natural areas (excluding beaches, dunes, sand plains, bare rock and glaciers and perpetual snow) | Square kilometre | European Union - 27 countries (from 2020) | 2023 | 190,086.87 | p |
Reviewed Eurostat observations; customised presentation, not an official Eurostat embed.
Eurostat dataset sdg_15_50; Area at risk of severe soil erosion by water; updated 2026-03-19T23:00:00+0100.
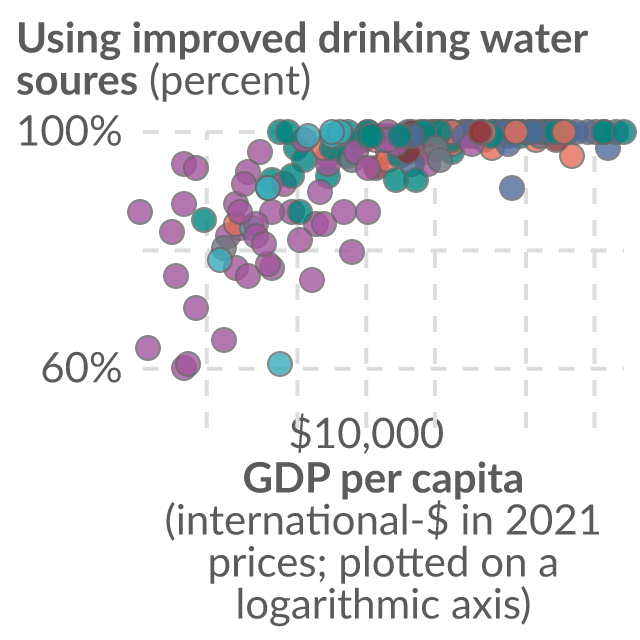
An improved drinking water source is a safely designed source, which includes piped water, protected wells and springs and other sources. GDP per capita is adjusted for inflation and differences in living costs between countries.
| Time frequency | Unit of measure | Nationality of registration of vessel | Transport coverage | Geopolitical entity (reporting) | Time | Value | Flag |
|---|---|---|---|---|---|---|---|
| Quarterly | Million tonne-kilometre (TKM) | Belgium | Total transport | European Union - 27 countries (from 2020) | 2020-Q1 | 2,970 | — |
| Quarterly | Million tonne-kilometre (TKM) | Belgium | Total transport | European Union - 27 countries (from 2020) | 2020-Q2 | 3,035 | — |
| Quarterly | Million tonne-kilometre (TKM) | Belgium | Total transport | European Union - 27 countries (from 2020) | 2020-Q3 | 2,834 | — |
| Quarterly | Million tonne-kilometre (TKM) | Belgium | Total transport | European Union - 27 countries (from 2020) | 2020-Q4 | 3,137 | — |
Reviewed Eurostat observations; customised presentation, not an official Eurostat embed. Showing 4 of 50.
Eurostat dataset iww_go_qnave; Inland waterway transport by nationality of vessel and coverage - quarterly data; updated 2026-09-10T23:00:00+0200.
| Time frequency | Unit of measure | Mode of transport | Geopolitical entity (reporting) | Time | Value | Flag |
|---|---|---|---|---|---|---|
| Annual | Percentage | Railways, inland waterways - sum of available data | European Union - 27 countries (from 2020) | 2020 | 22.9 | e |
| Annual | Percentage | Railways, inland waterways - sum of available data | European Union - 27 countries (from 2020) | 2021 | 23 | e |
| Annual | Percentage | Railways, inland waterways - sum of available data | European Union - 27 countries (from 2020) | 2022 | 22.6 | e |
| Annual | Percentage | Railways, inland waterways - sum of available data | European Union - 27 countries (from 2020) | 2023 | 21.9 | e |
Reviewed Eurostat observations; customised presentation, not an official Eurostat embed. Showing 4 of 15.
Eurostat dataset sdg_09_60; Share of rail and inland waterways in inland freight transport; updated 2026-03-17T23:00:00+0100.
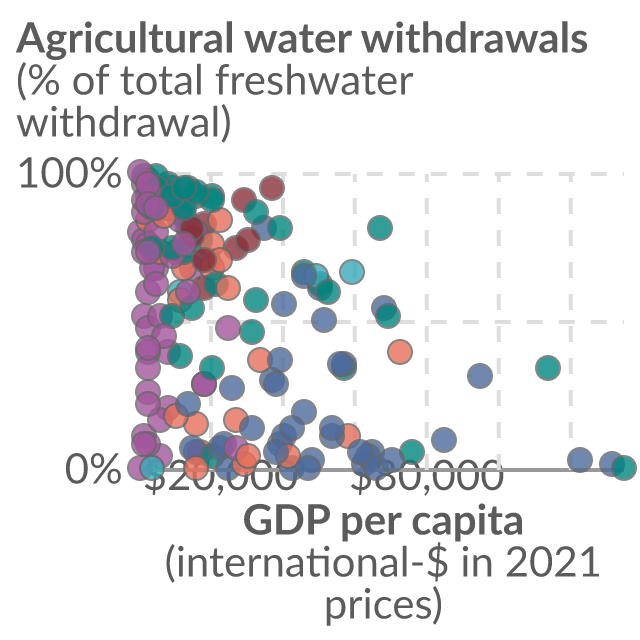
Share of total water withdrawals used in agriculture versus gross domestic product (GDP) per capita, adjusted for inflation and differences in living costs between countries.
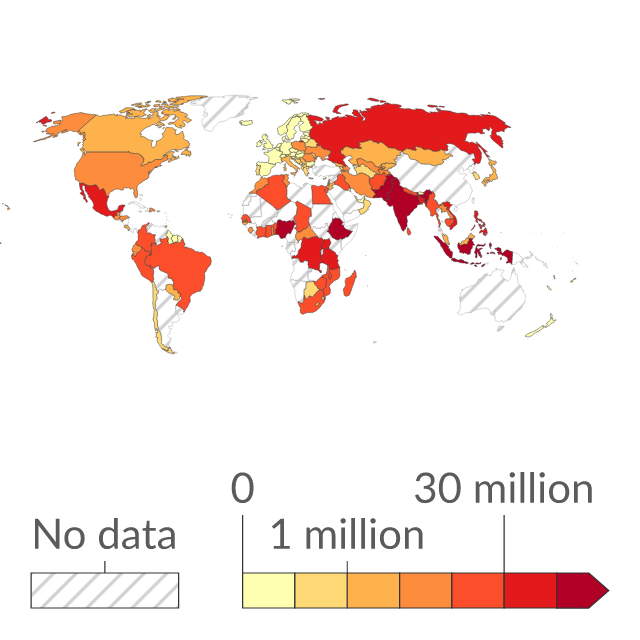
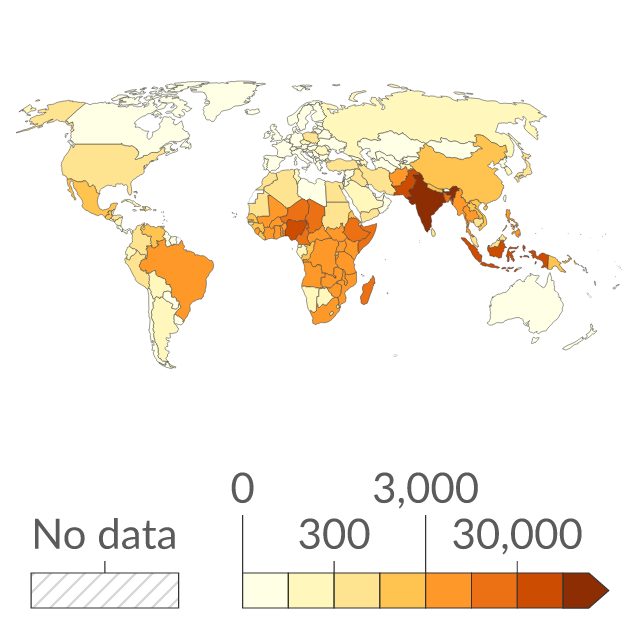
Estimated annual number of deaths attributed to unsafe water sources. Here the attributable burden is the number of deaths that would no longer occur if the entire population had access to high-quality piped water.
Integrated water resource management (IWRM) is a process which promotes the coordinated development and management of water, land and related resources in order to maximise economic and social welfare in an equitable manner without compromising the sustainability of vital ecosystems.