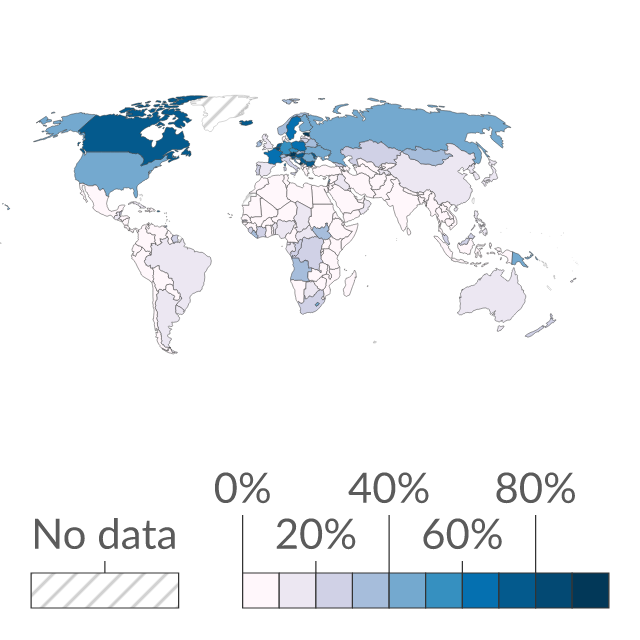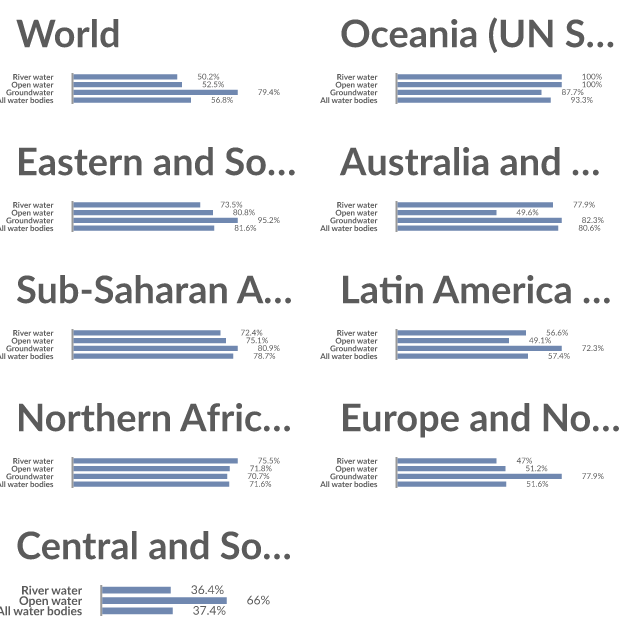
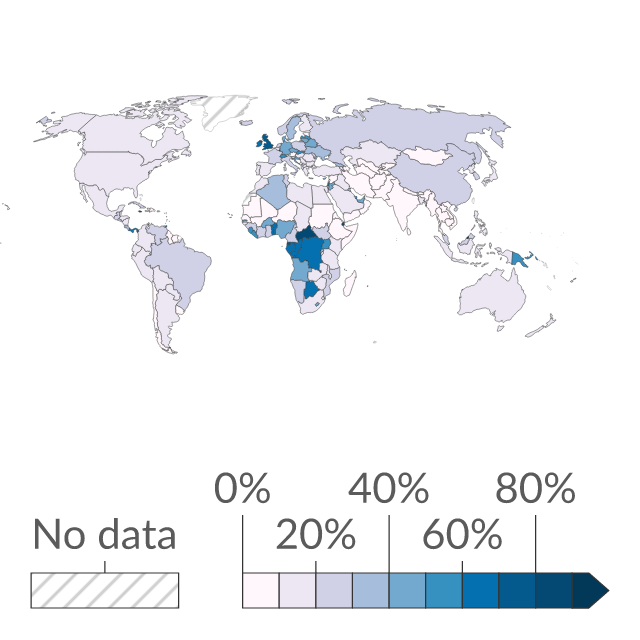
Industrial water as a share of total water withdrawals
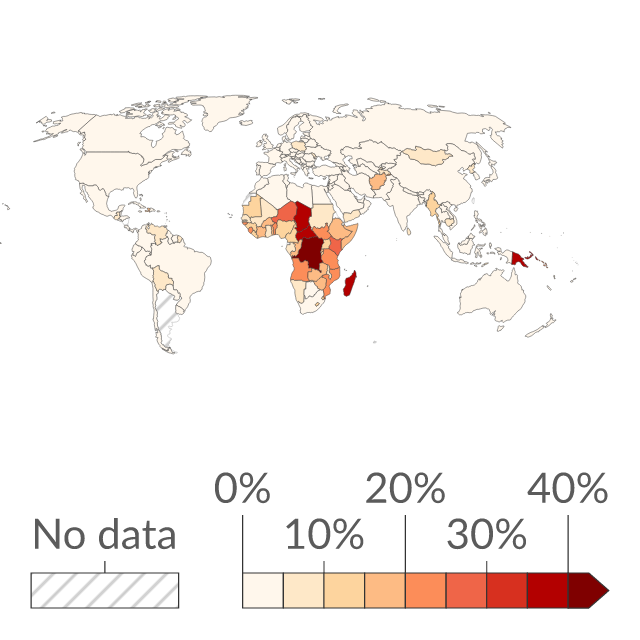
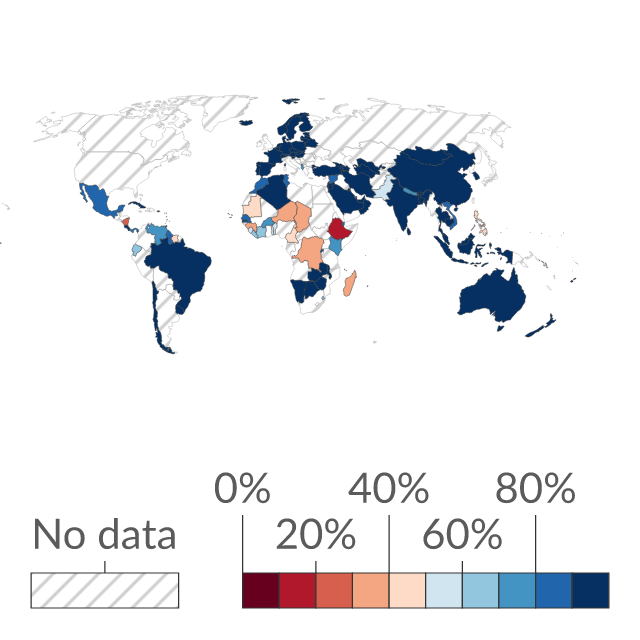
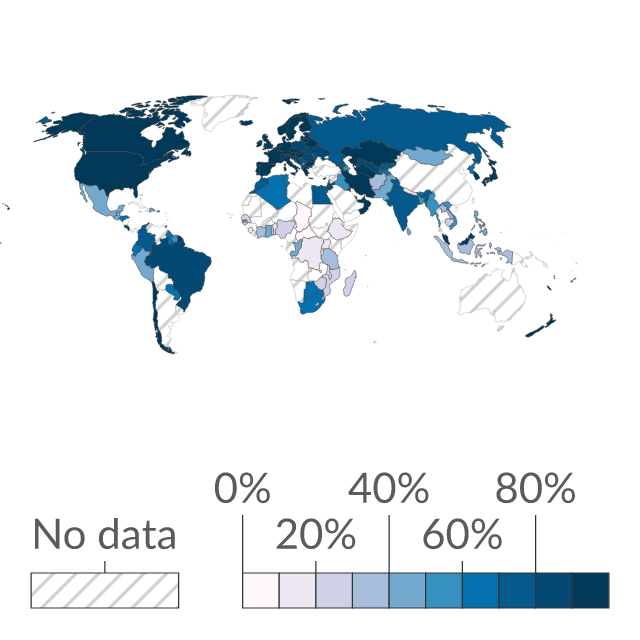
Industrial water withdrawals as a percentage of total water withdrawals (which is the sum of water used for agriculture, industry, and municipal purposes).
Where publishers find data.
Source links, freshness and reuse rights stay visible on every result.
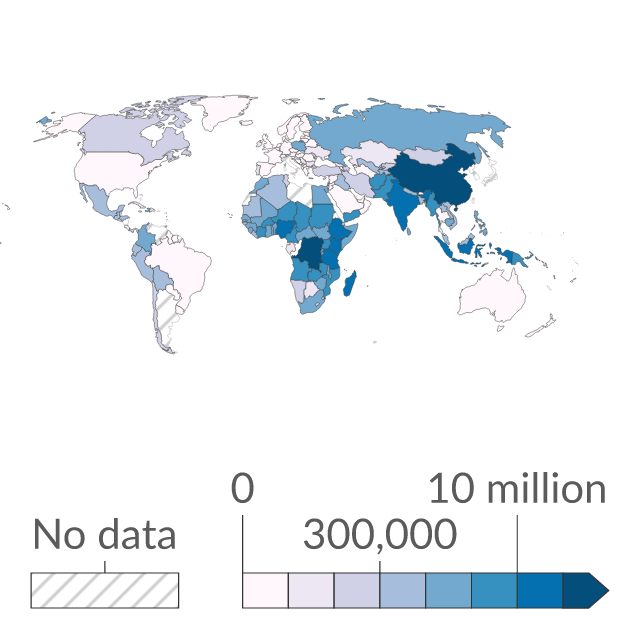
Industrial water withdrawals as a percentage of total water withdrawals (which is the sum of water used for agriculture, industry, and municipal purposes).
Municipal (domestic) water withdrawals as a percentage of total water withdrawals (which is the sum of water used for agriculture, industry, and municipal purposes).
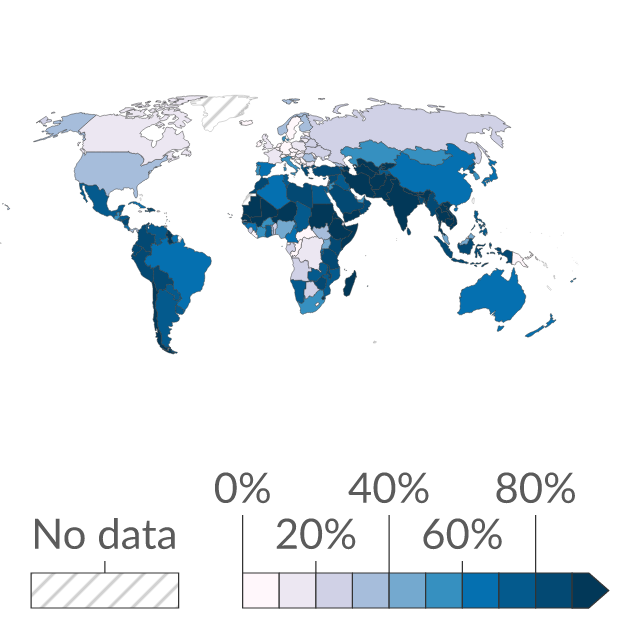
Agricultural water withdrawals as a percentage of total water withdrawals (which is the sum of water used for agriculture, industry and domestic purposes). Agricultural water is defined as the annual quantity of self-supplied water withdrawn for irrigation, livestock and aquaculture purposes.
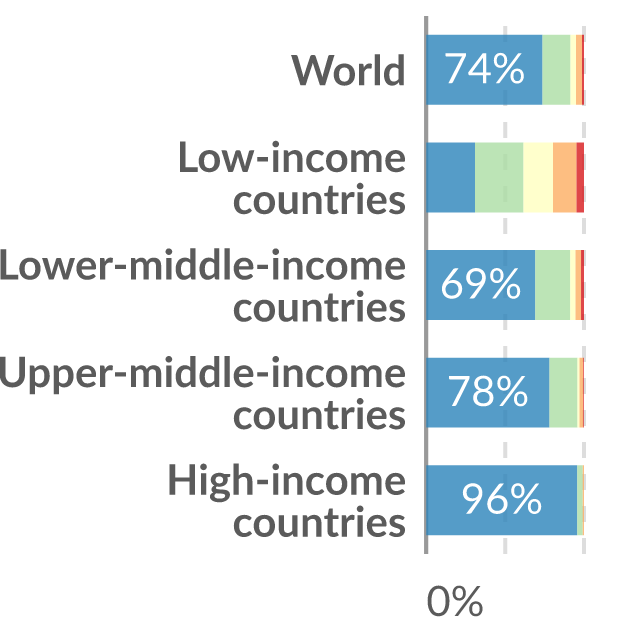
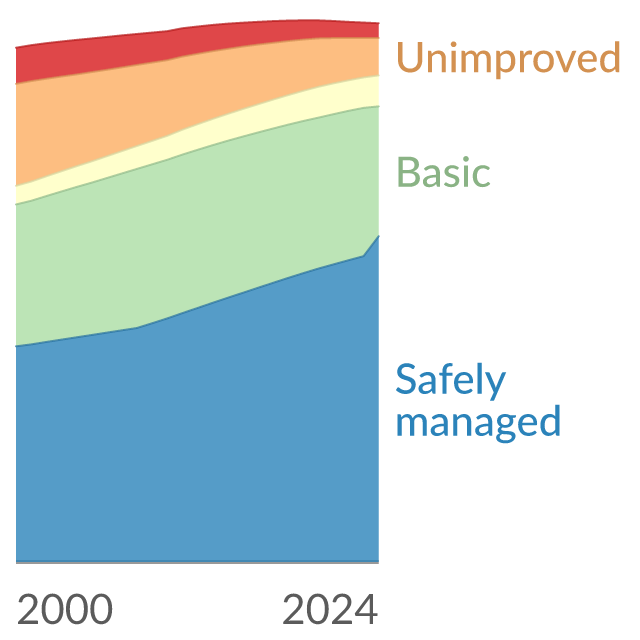
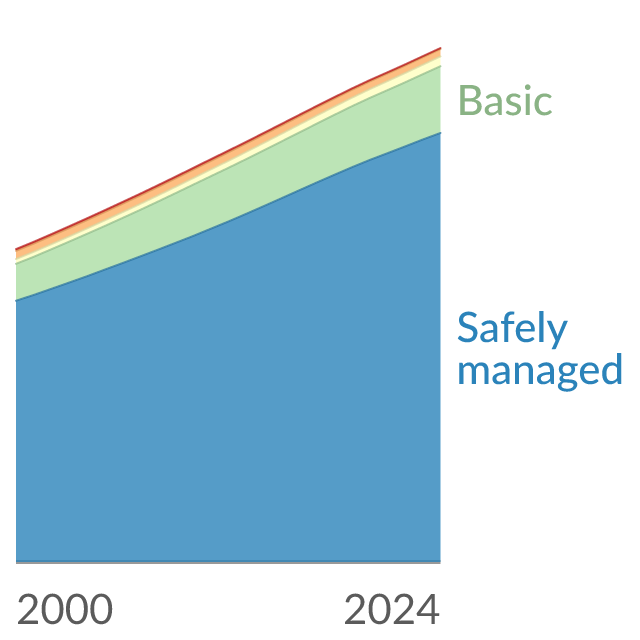
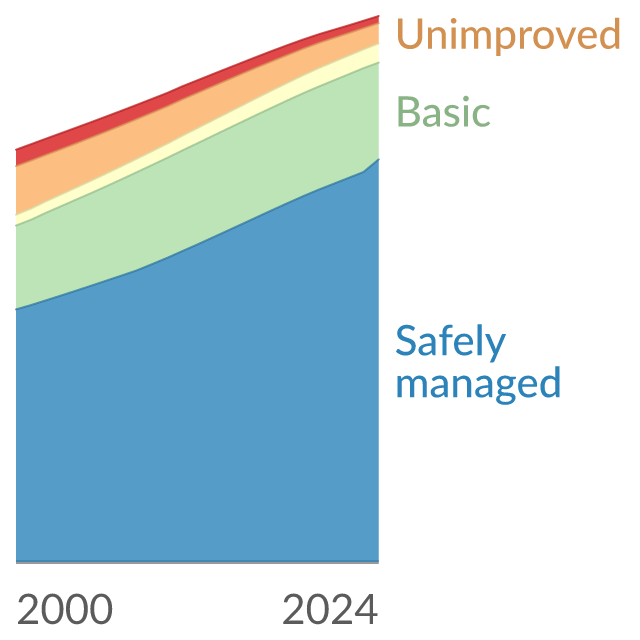
Total population using the five different levels of drinking water services: surface water, unimproved, limited, basic and safely managed water.
| Time frequency | Unit of measure | Transport infrastructure | Geopolitical entity (reporting) | Time | Value |
|---|---|---|---|---|---|
| Annual | Kilometre | Total | European Union - 27 countries (from 2020) | 2022 | 50,385.25 |
| Annual | Kilometre | Total | European Union - 27 countries (from 2020) | 2023 | 50,541.85 |
| Annual | Kilometre | Total | European Union - 27 countries (from 2020) | 2024 | 50,425.95 |
Reviewed Eurostat observations; customised presentation, not an official Eurostat embed.
Eurostat dataset iww_if_infrastr; Length of navigable inland waterways by waterway type; updated 2026-07-29T23:00:00+0200.
Water quality is assessed by means of core physical and chemical parameters that reflect natural water quality. A water body is classified as "good" quality if at least 80% of monitoring values meet target quality levels.
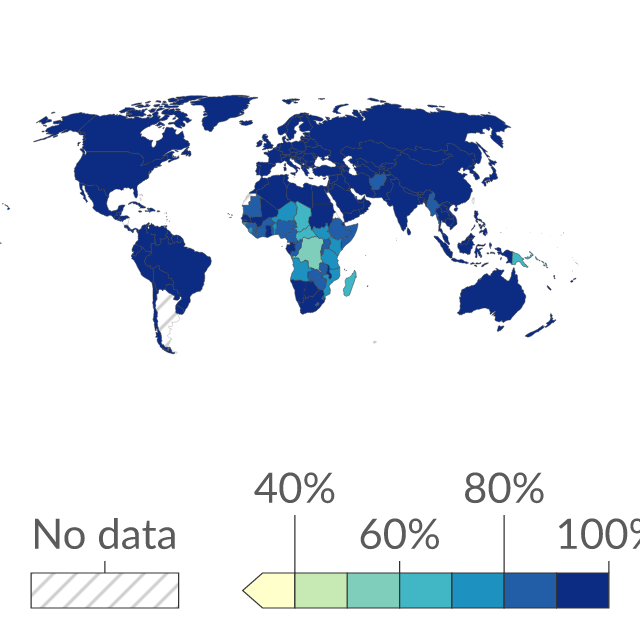
Improved drinking water sources are designed to deliver safe water and include piped water, boreholes or tubewells, protected dug wells, protected springs, rainwater, and packaged or delivered water.
Improved drinking water sources are designed to deliver safe water and include: piped water, boreholes or tubewells, protected springs or wells, rainwater, and packaged or delivered water. If no safe and reliable water source is available, people use surface water sources or unprotected springs or wells.
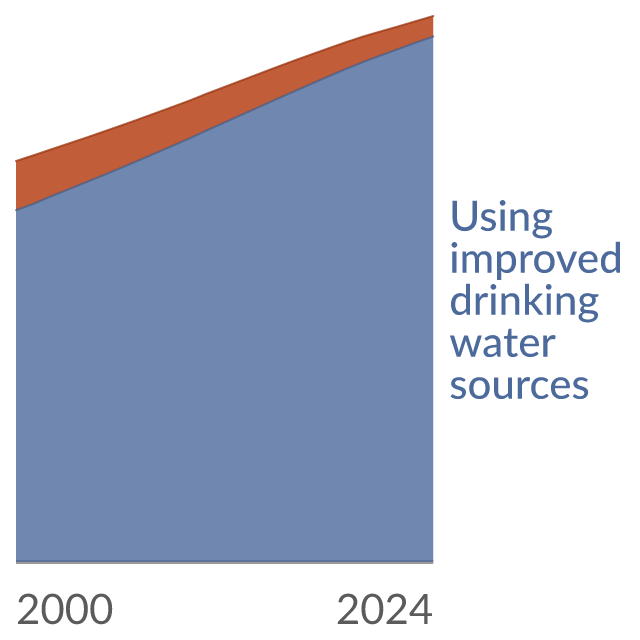
Improved drinking water sources are those designed to deliver safe water and include: piped water, boreholes or tubewells, protected dug wells, protected springs, rainwater, and packaged or delivered water.
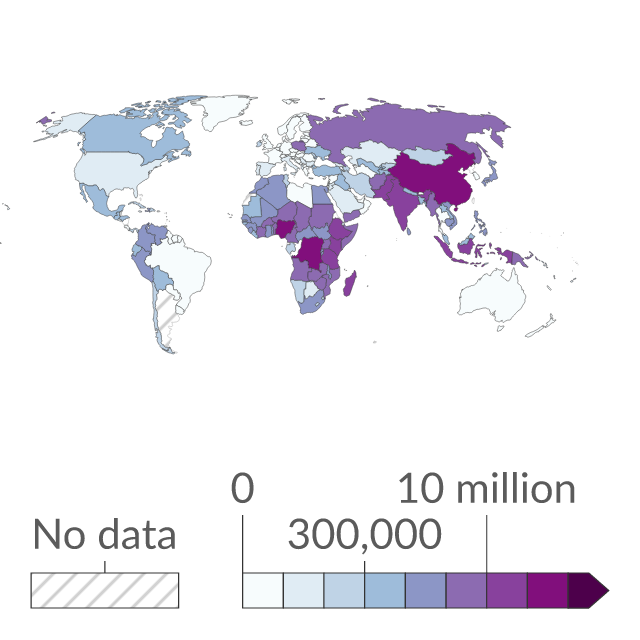
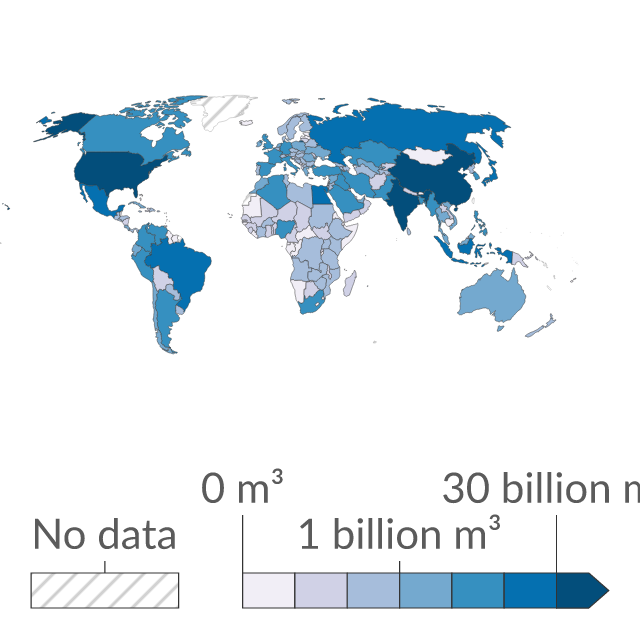
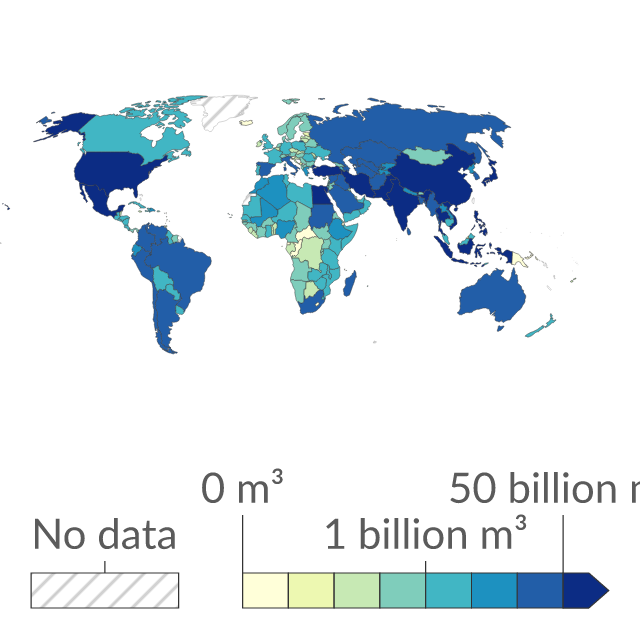
Total water withdrawal for municipal (domestic) purposes, measured in cubic meters (m³) per year. Municipal water is the annual quantity of water withdrawn primarily for the direct use by the population.
Improved drinking water sources are those that can deliver safe water. They include piped water, boreholes or tube wells, protected dug wells, protected springs, rainwater, and packaged or delivered water.
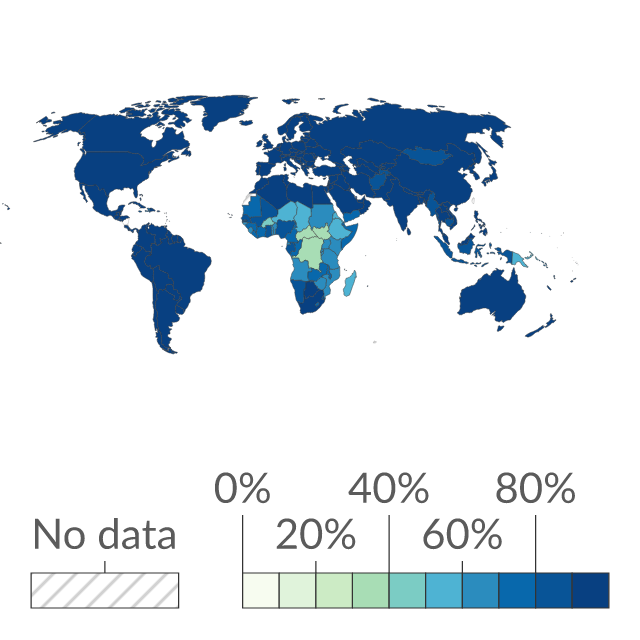
Share of people who use an improved drinking water source, regardless of collection time. An improved drinking water source is a safely designed drinking water source and includes e.g. piped water, boreholes or tubewells and packaged or delivered water.
Share of population using five different levels of drinking water services: safely managed, basic, limited, unimproved and surface water.
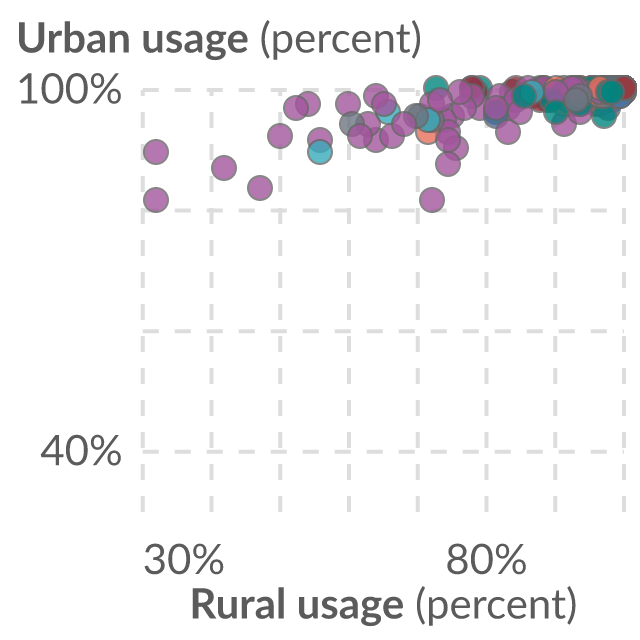
Rural population using the five different levels of drinking water services: safely managed; basic, limited, unimproved and surface water.
A basic drinking water service is water from an improved water source that can be collected within a 30-minute round trip, including queuing.
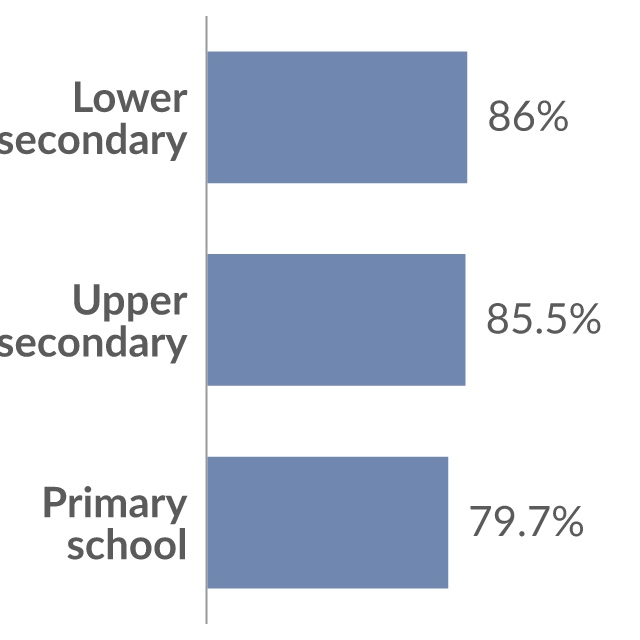
Share of public primary schools with a drinking water facility or water delivery point that is designed to protect water from external contamination, particularly of fecal origin.
Urban population using each of the five different levels of drinking water services: surface water, unimproved, limited, basic and safely managed.
Safely managed drinking water service means an improved water source is located on the premises, available when needed, and free from contamination.
| Time frequency | Unit of measure | Type of vessel | Transport coverage | Geopolitical entity (reporting) | Time | Value |
|---|---|---|---|---|---|---|
| Annual | Thousand tonnes | Total | Total transport | European Union - 27 countries (from 2020) | 2020 | 495,560 |
| Annual | Thousand tonnes | Total | Total transport | European Union - 27 countries (from 2020) | 2021 | 513,925 |
| Annual | Thousand tonnes | Total | Total transport | European Union - 27 countries (from 2020) | 2022 | 488,144 |
| Annual | Thousand tonnes | Total | Total transport | European Union - 27 countries (from 2020) | 2023 | 468,916 |
Reviewed Eurostat observations; customised presentation, not an official Eurostat embed. Showing 4 of 12.
Eurostat dataset ttr00007; Goods transport by inland waterways; updated 2026-07-28T23:00:00+0200.
Improved drinking water sources are designed to deliver safe drinking water such as piped water connections, public taps or standpipes, tube wells or boreholes, protected dug wells, protected springs, and rainwater collection.
Total agricultural withdrawals, measured in m³ per year. Agricultural water is defined as the annual quantity of self-supplied water withdrawn for irrigation, livestock and aquaculture purposes.
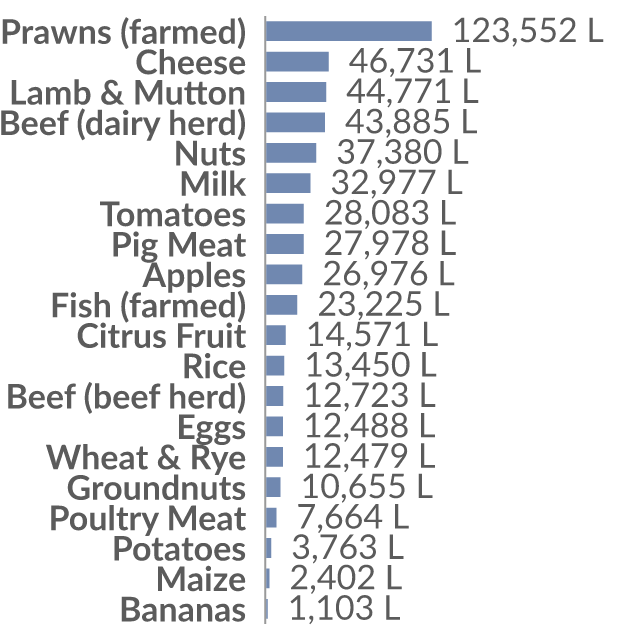
Scarcity-weighted water use represents freshwater use weighted by local water scarcity. This is measured in liters per 1000 kilocalories.
| Time frequency | Statistical information | Unit of measure | Geopolitical entity (reporting) | Time | Value |
|---|---|---|---|---|---|
| Annual | Four-year average | Percentage | European Union - 27 countries (from 2020) | 2020 | 4.65 |
| Annual | Four-year average | Percentage | European Union - 27 countries (from 2020) | 2021 | 4.74 |
| Annual | Four-year average | Percentage | European Union - 27 countries (from 2020) | 2022 | 5.32 |
| Annual | Four-year average | Percentage | European Union - 27 countries (from 2020) | 2023 | 5.47 |
Reviewed Eurostat observations; customised presentation, not an official Eurostat embed. Showing 4 of 8.
Eurostat dataset sdg_06_60; Water exploitation index, plus (WEI+); updated 2026-04-28T23:00:00+0200.