Where publishers find data.

Results for “water”

Source links, freshness and reuse rights stay visible on every result.

Page 6 · 19 results
Filters
FiltersClear
Asset type
Source
Commercial use
Rights review
Freshness
PreviewSubmitted image
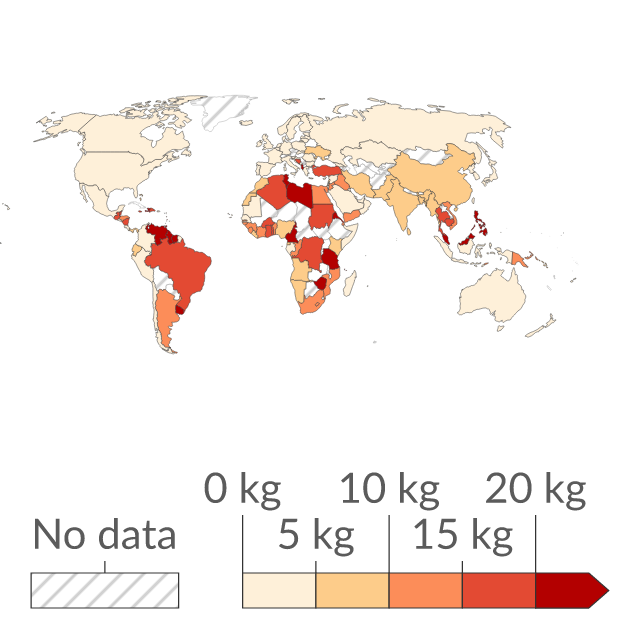
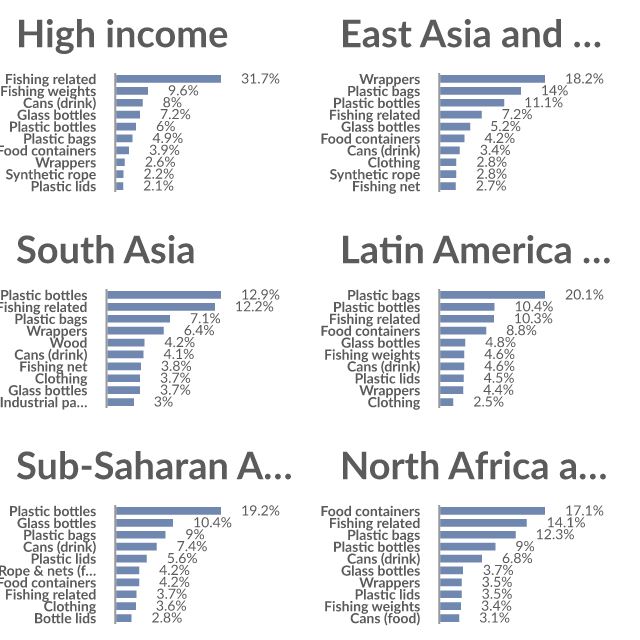
Preview of Mismanaged plastic waste per capita
ChartOur World in Data

Mismanaged plastic waste per capita

Mismanaged plastic waste is waste that is not recycled, incinerated, or kept in sealed landfills. It includes materials burned in open pits, dumped into seas or open waters, or disposed of in unsanitary landfills and dumpsites.
Source
Our World in Data
Updated
30 Apr 2021
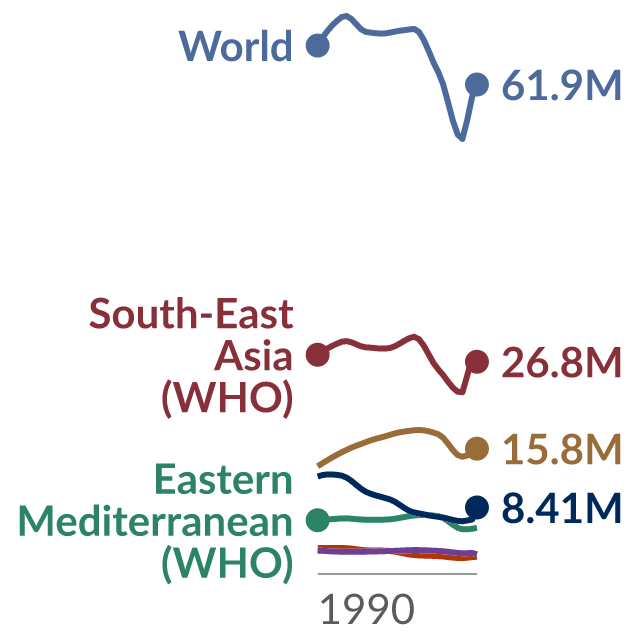
PreviewSubmitted image
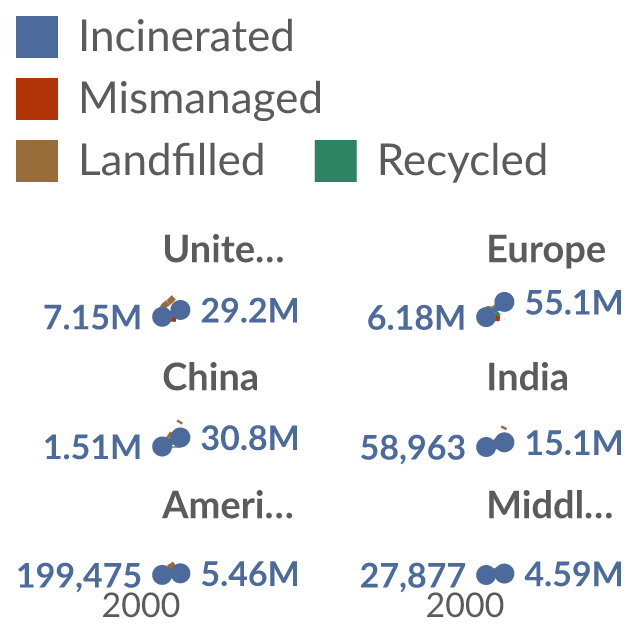
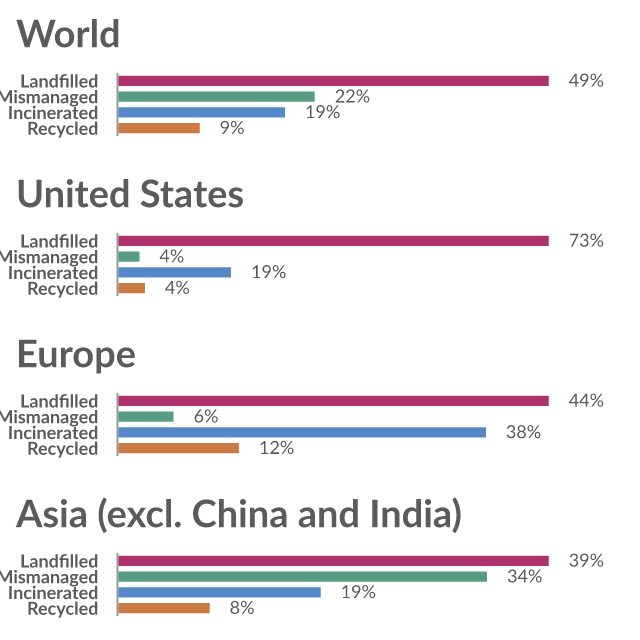
Preview of Plastic waste by disposal method with projections
ChartOur World in Data

Plastic waste by disposal method with projections

Mismanaged plastic waste includes materials burned in open pits, dumped into seas or open waters, or disposed of in unsanitary landfills and dumpsites. Projections are based on the "business-as-usual" scenario which assumes that current policies remain unchanged in the foreseeable future.
Source
Our World in Data
Updated
21 Sept 2023
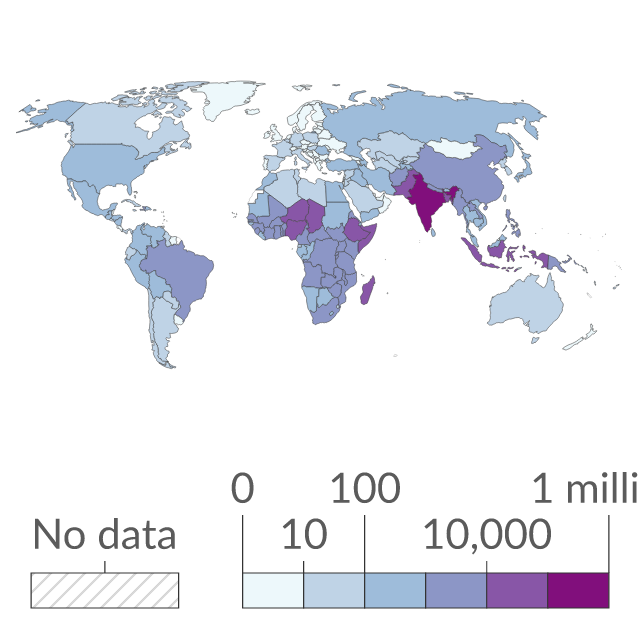
PreviewSubmitted image
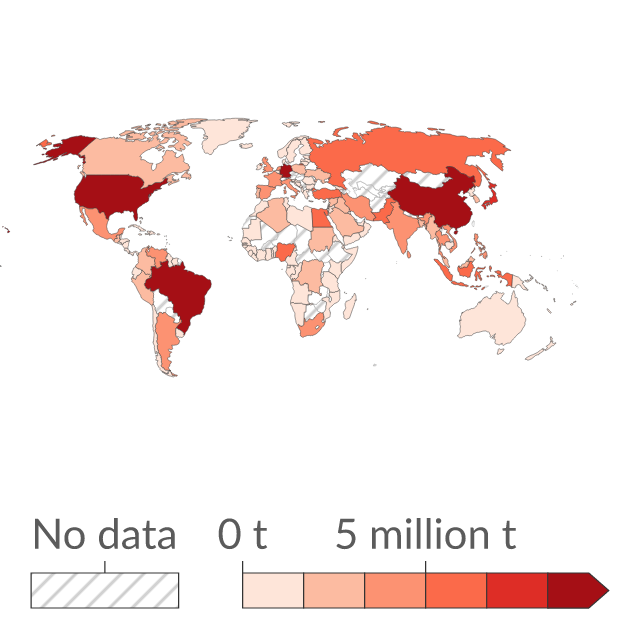
Preview of Plastic waste generation
ChartOur World in Data

Plastic waste generation

This measures total plastic waste generation prior to management and therefore does not represent the quantity of plastic at risk of polluting waterways, rivers and the ocean environment.

Source
Our World in Data
Updated
01 Jan 2017
PreviewSubmitted image
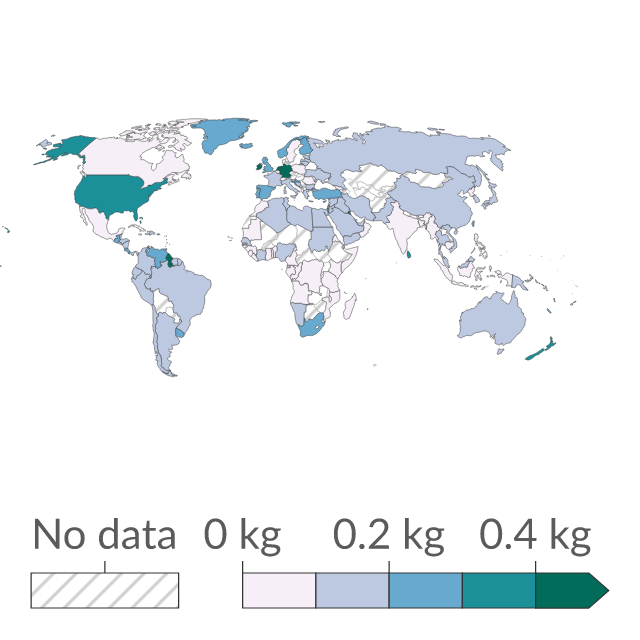
Preview of Plastic waste generation per capita
ChartOur World in Data

Plastic waste generation per capita

Daily plastic waste generation per person, measured in kilograms per person per day. This measures the overall per capita plastic waste generation rate prior to waste management, recycling or incineration. It does not therefore directly indicate the risk of pollution to waterways or marine environments.

Source
Our World in Data
Updated
22 Nov 2017
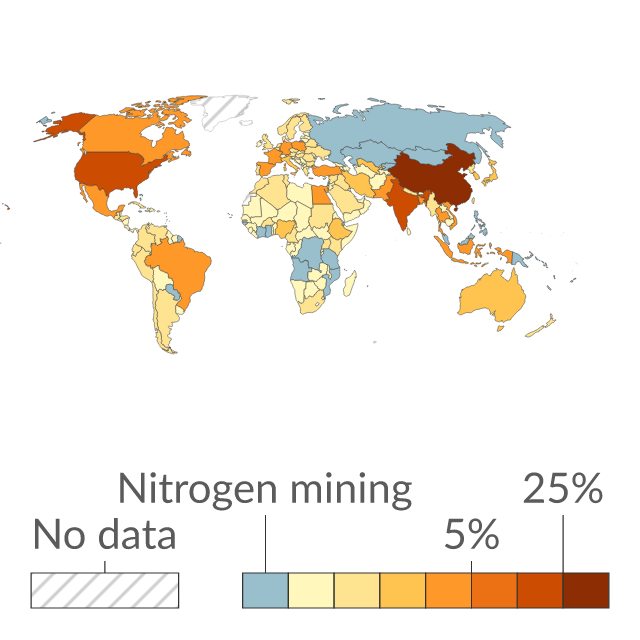
PreviewSubmitted image
Preview of Share of global excess nitrogen from croplands
ChartOur World in Data

Share of global excess nitrogen from croplands

"Excess nitrogen" is the difference between nutrient inputs (from fertilizers, manure, and fixation from legumes) and the amount harvested in crop material. This represents nitrogen that is lost to the environment and can create ecological imbalances in ecosystems and water bodies.

Source
Our World in Data
Updated
01 Jan 2014
PreviewSubmitted image
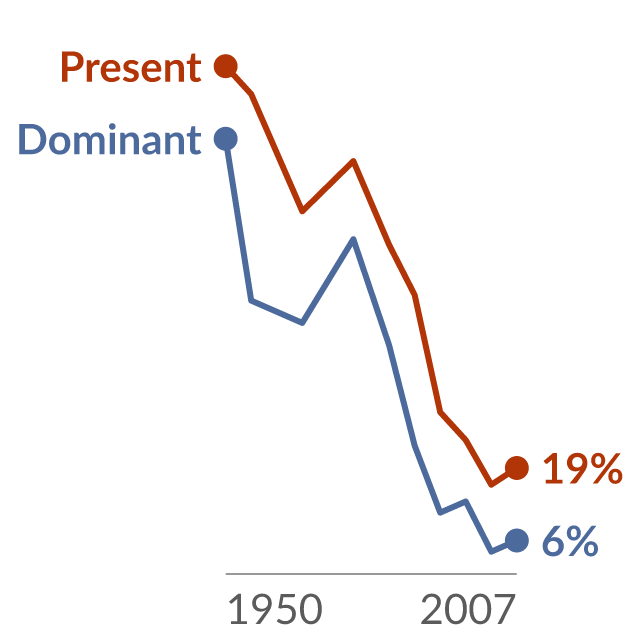
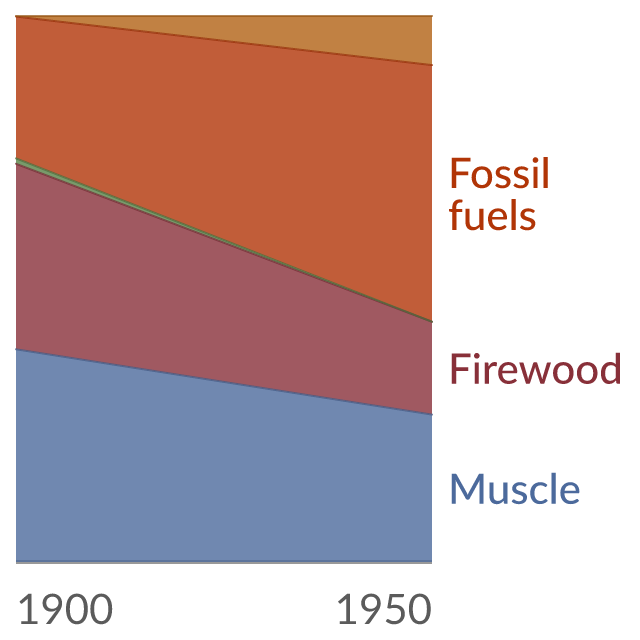
Preview of The long-term energy transition in Europe
ChartOur World in Data

The long-term energy transition in Europe

Share of energy production by traditional energy carrier, measured as the percentage of total energy production, from 1850-2000. "Muscle energy corresponds to the input of food by men and working animals; firewood to the actual consumption; wind and water have been estimated from the power of water and wind engines – sailing ships included – and the time, per year, these engines were in use”.

Source
Our World in Data
Updated
26 Jun 2017
PreviewSubmitted image
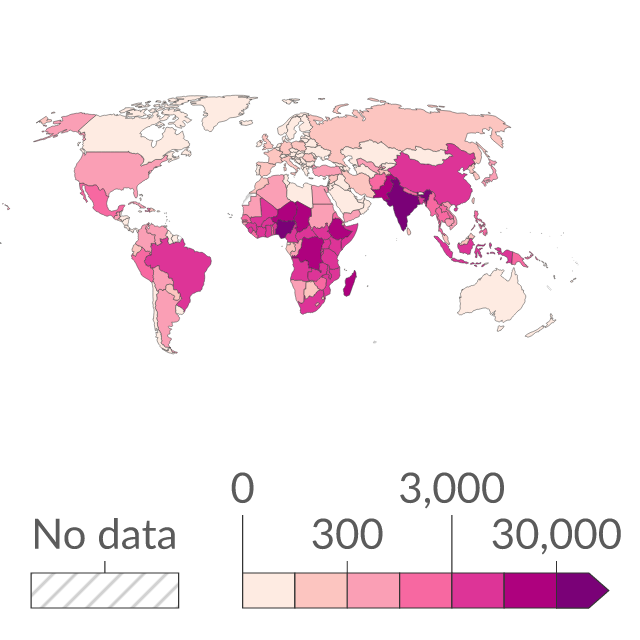
Preview of Total cases of diarrheal diseases
ChartOur World in Data

Total cases of diarrheal diseases

Estimated number of current cases of diarrheal diseases. Diarrheal diseases are caused by various pathogens such viruses and bacteria and can be spread through contaminated food or drinking water, or between people directly.

Source
Our World in Data
Updated
07 Feb 2026