
PreviewSubmitted image
ChartOur World in Data
Where publishers find data.
Source links, freshness and reuse rights stay visible on every result.
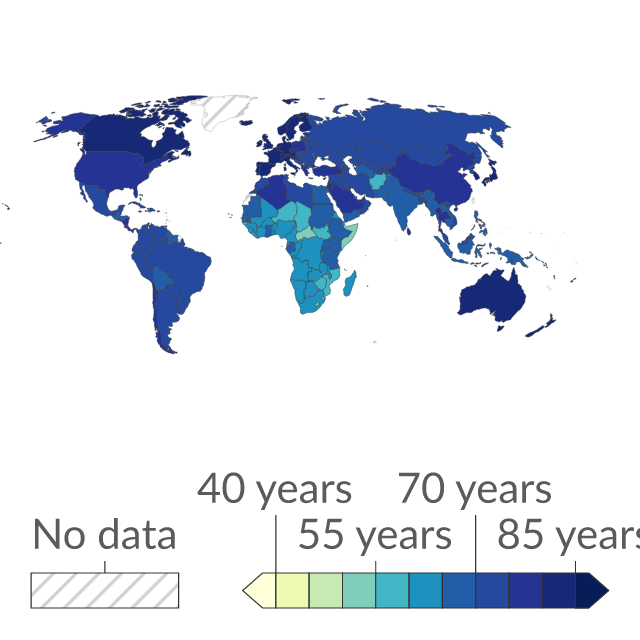
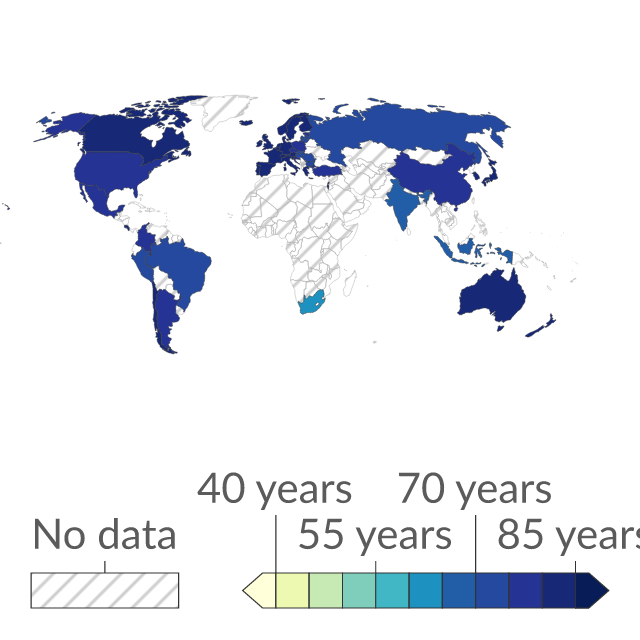
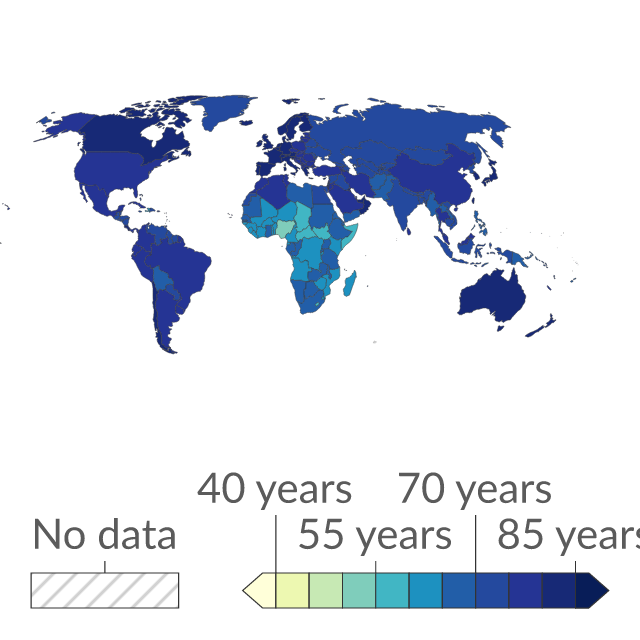

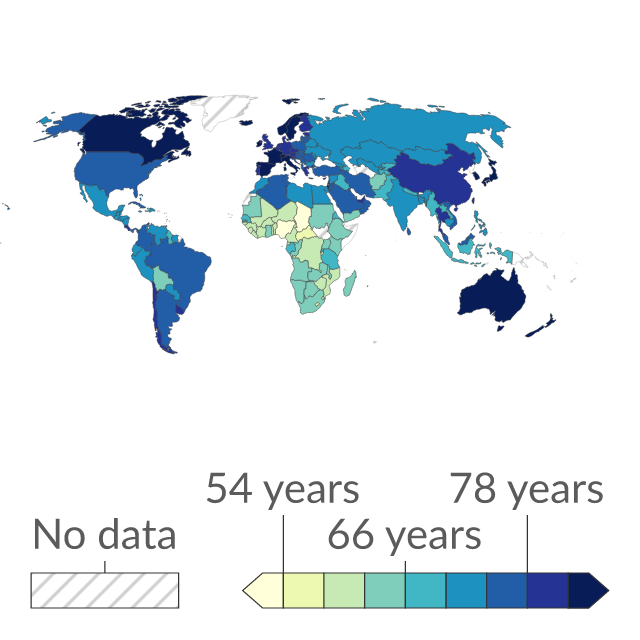
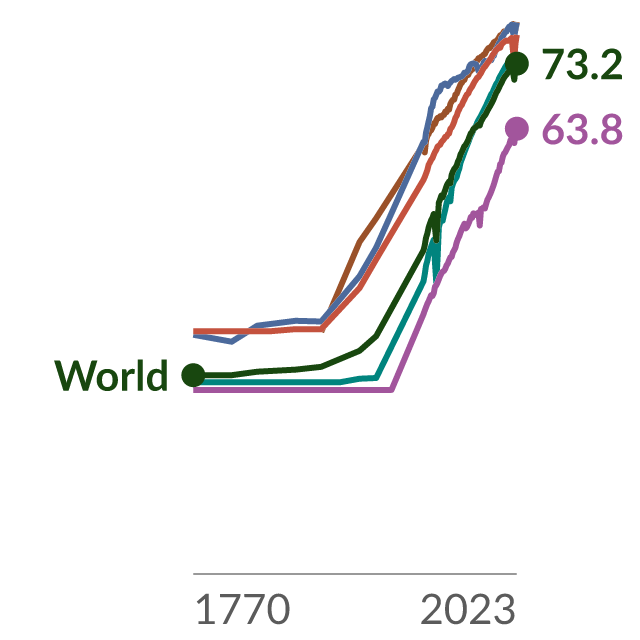
Average number of years a newborn would live if age-specific mortality rates in the current year were to stay the same throughout its life.
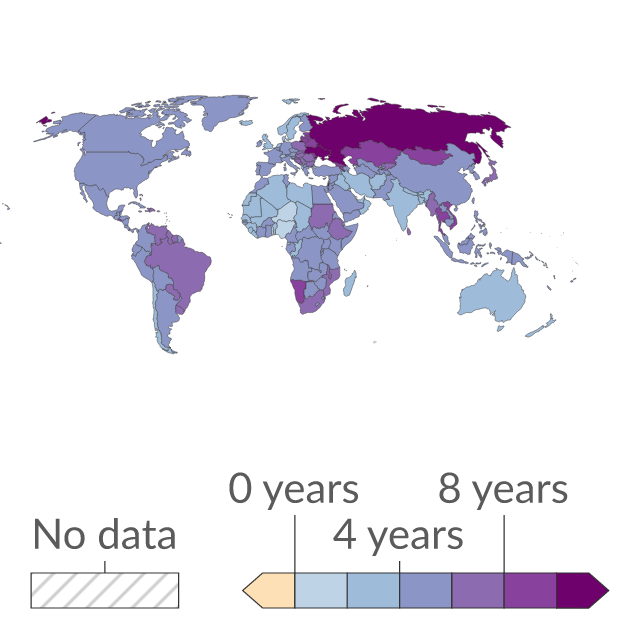
Difference between female and male life expectancy at birth. Positive values indicate higher female life expectancy; negative values indicate higher male life expectancy.
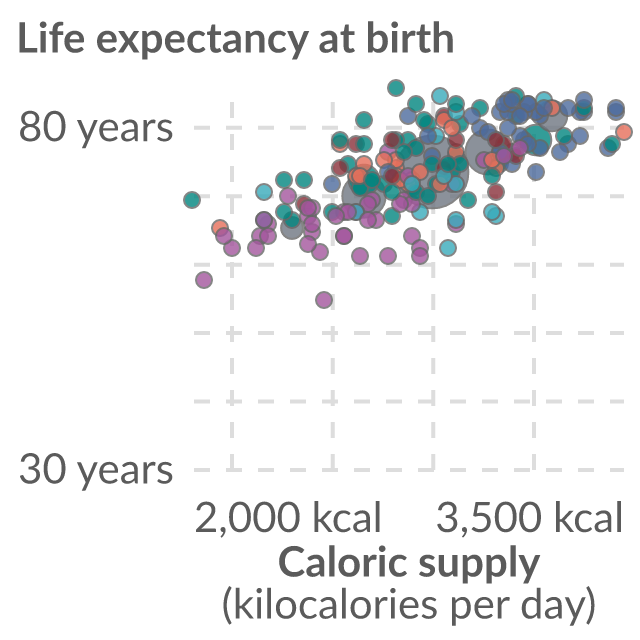
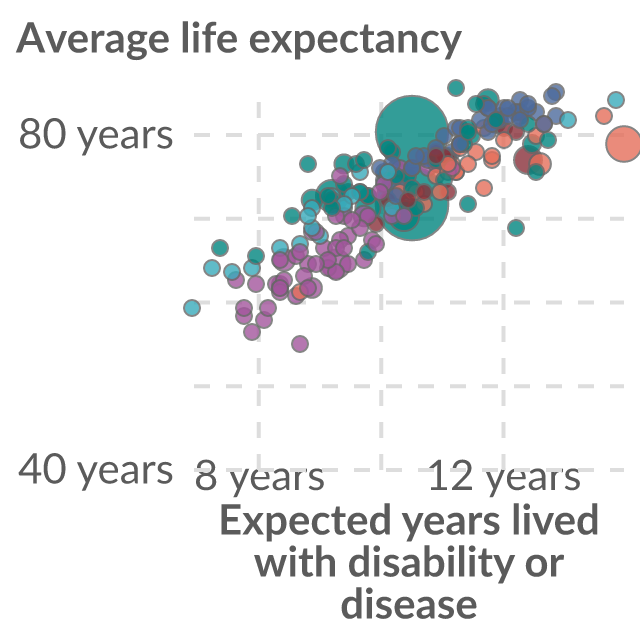
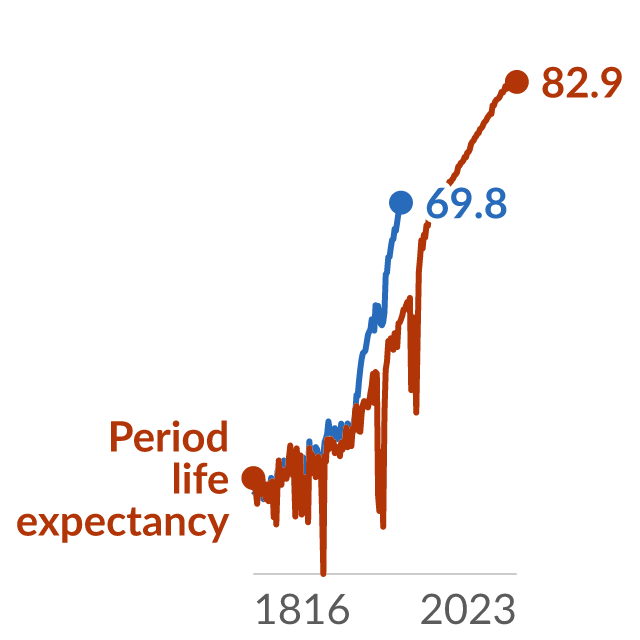
Two different approaches to calculating life expectancy at birth are compared: period life expectancy (based on death rates in one particular year) and cohort life expectancy (based on average lifespans).
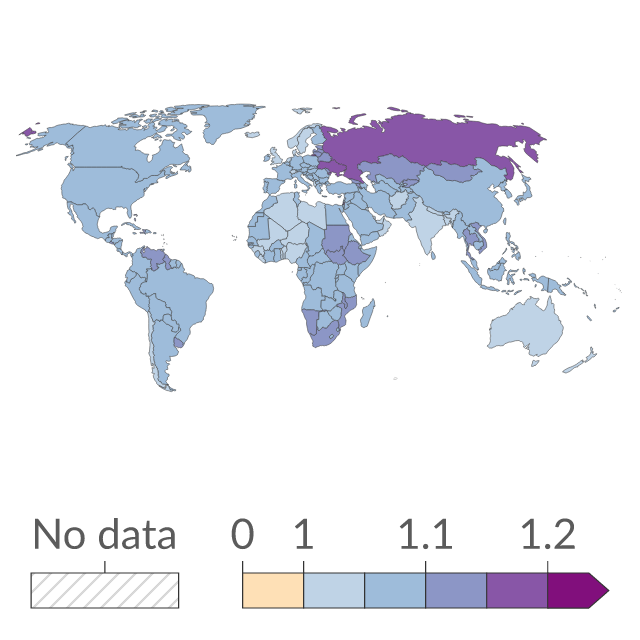
The ratio of female to male period life expectancy at birth. Values higher than 1 indicate higher female life expectancy.
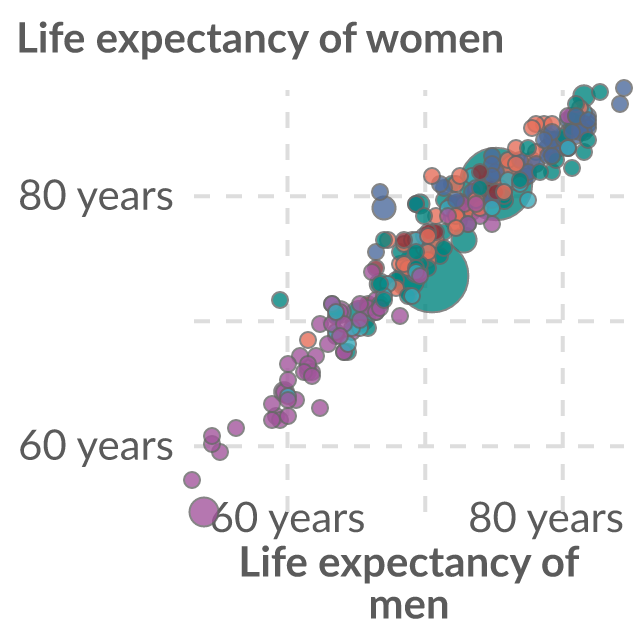
The period life expectancy at birth, in a given year.
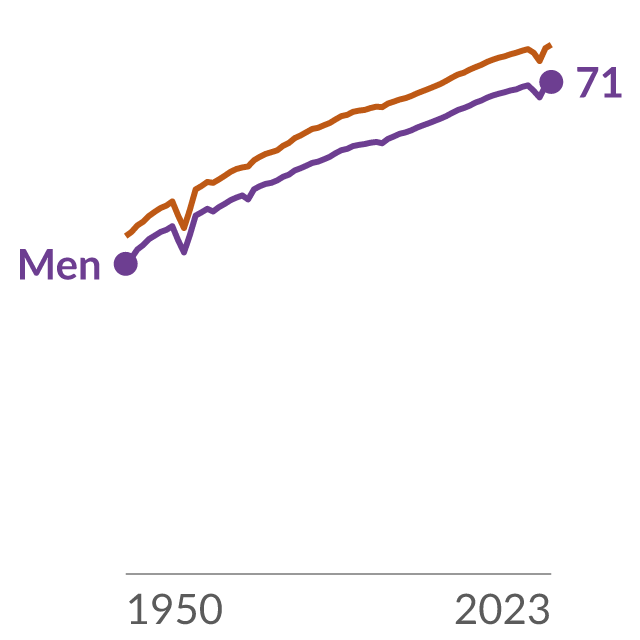
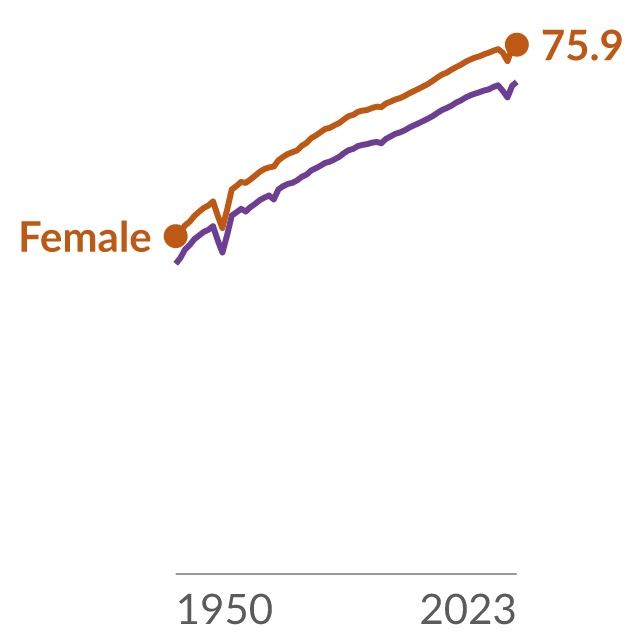
The period life expectancy at birth, shown for women and men.
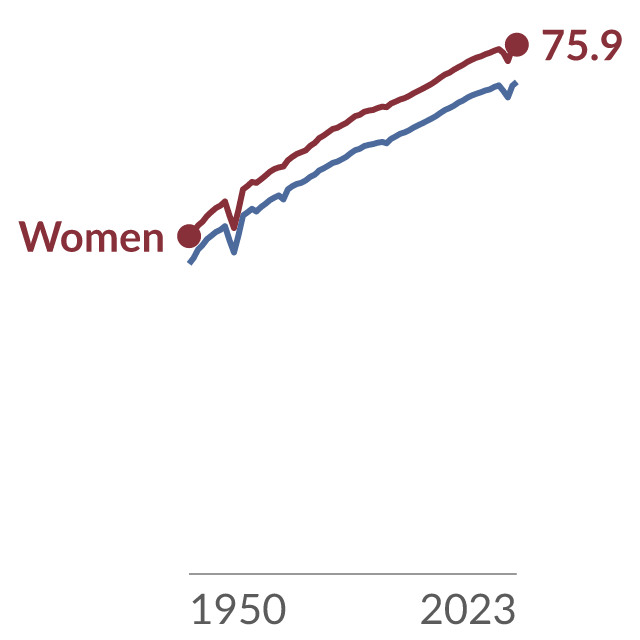
The period life expectancy at birth, shown for women and men.
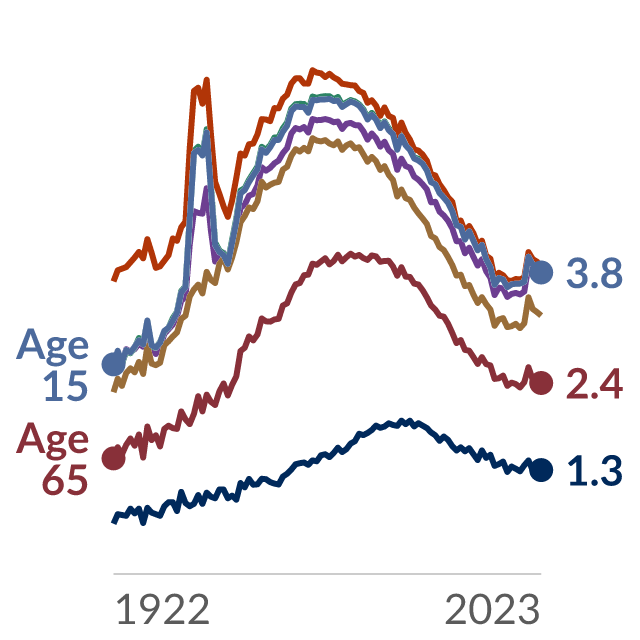
The sex gap of female minus male life expectancy at different ages. Positive values indicate higher life expectancy among females; negative values indicate higher life expectancy among males.
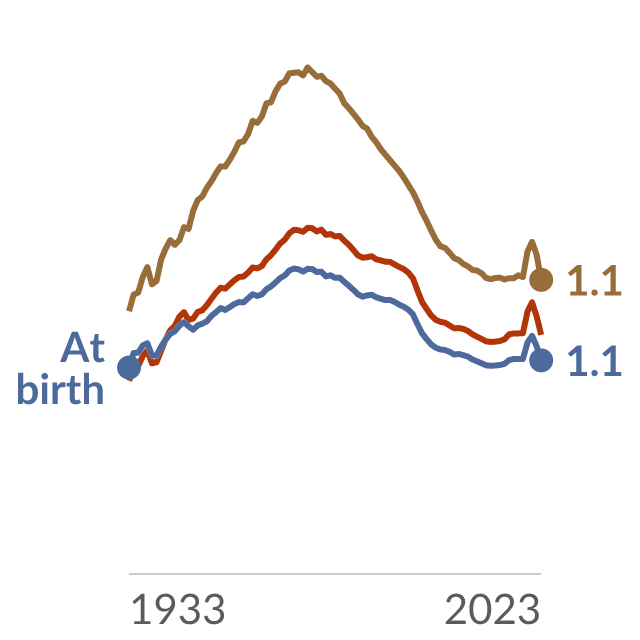
The ratio of female to male period life expectancy at different ages. Values higher than 1 indicate higher female life expectancy.
| Time frequency | Unit of measure | Sex | Age class | Geopolitical entity (reporting) | Time | Value | Flag |
|---|---|---|---|---|---|---|---|
| Annual | Year | Total | Less than 1 year | European Union - 27 countries (from 2020) | 2020 | 80.3 | bep |
| Annual | Year | Total | Less than 1 year | European Union - 27 countries (from 2020) | 2021 | 80 | bep |
| Annual | Year | Total | Less than 1 year | European Union - 27 countries (from 2020) | 2022 | 80.6 | bep |
| Annual | Year | Total | Less than 1 year | European Union - 27 countries (from 2020) | 2023 | 81.2 | bep |
Reviewed Eurostat observations; customised presentation, not an official Eurostat embed. Showing 4 of 15.
Eurostat dataset tps00205; Life expectancy at birth by sex; updated 2026-06-04T23:00:00+0200.
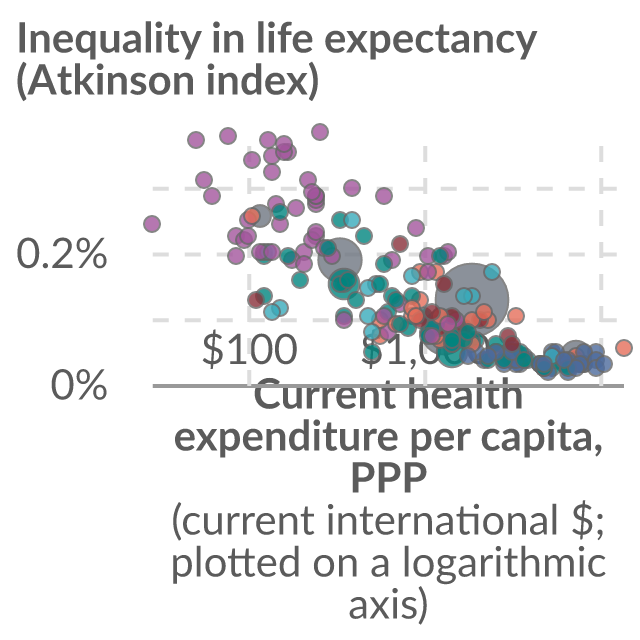
| Time frequency | Unit of measure | Sex | Health and life expectancy | Geopolitical entity (reporting) | Time | Value | Flag |
|---|---|---|---|---|---|---|---|
| Annual | Year | Males | Life expectancy in absolute value at birth | European Union - 27 countries (from 2020) | 2020 | 77.5 | — |
| Annual | Year | Males | Life expectancy in absolute value at birth | European Union - 27 countries (from 2020) | 2021 | 77.2 | — |
| Annual | Year | Males | Life expectancy in absolute value at birth | European Union - 27 countries (from 2020) | 2022 | 77.9 | — |
| Annual | Year | Males | Life expectancy in absolute value at birth | European Union - 27 countries (from 2020) | 2023 | 78.7 | bep |
Reviewed Eurostat observations; customised presentation, not an official Eurostat embed. Showing 4 of 10.
Eurostat dataset tps00208; Life expectancy at birth by sex; updated 2026-07-17T23:00:00+0200.
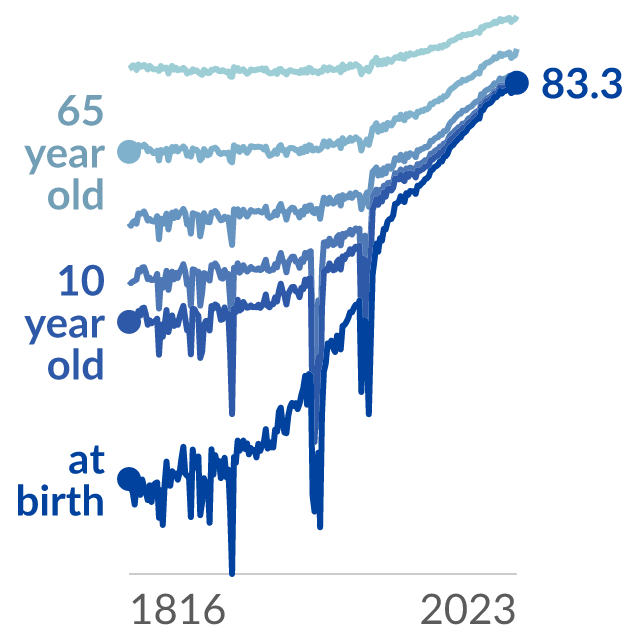
Total period life expectancy for people who have reached a given age.
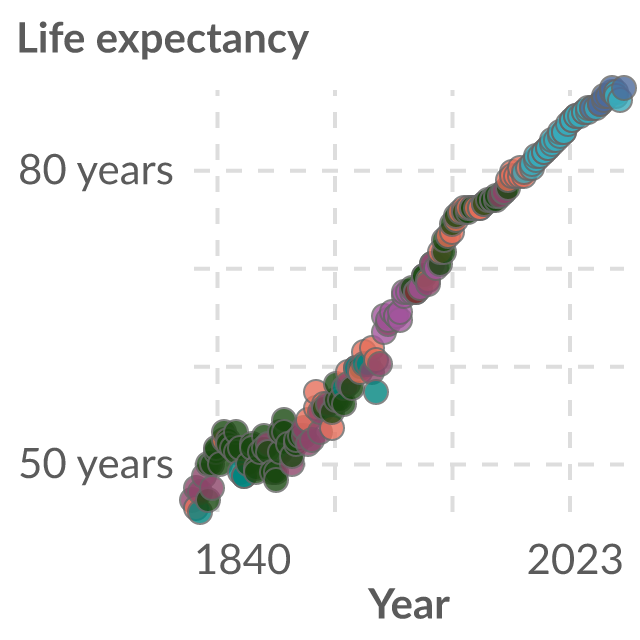
The country with the highest female life expectancy at birth, in each year.
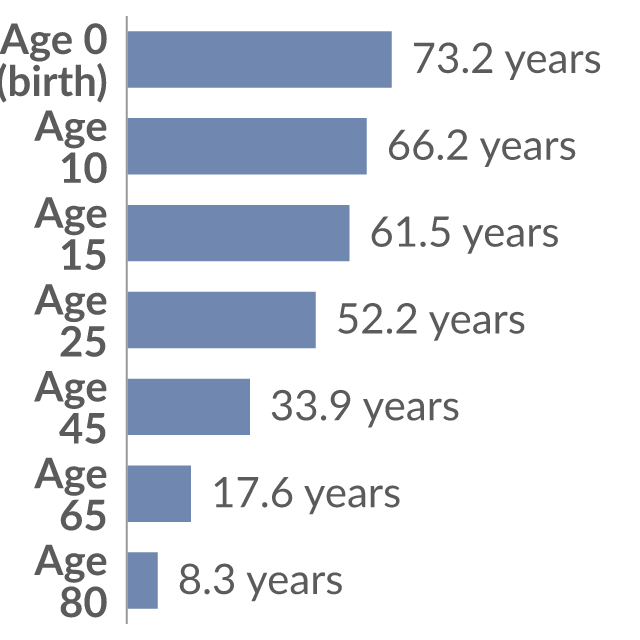
The remaining period life expectancy of people who have reached a given age.
| Time frequency | Unit of measure | Sex | Age class | Geopolitical entity (reporting) | Time | Value | Flag |
|---|---|---|---|---|---|---|---|
| Annual | Year | Total | Less than 1 year | European Union - 27 countries (from 2020) | 2020 | 80.3 | bep |
| Annual | Year | Total | Less than 1 year | European Union - 27 countries (from 2020) | 2021 | 80 | bep |
| Annual | Year | Total | Less than 1 year | European Union - 27 countries (from 2020) | 2022 | 80.6 | bep |
| Annual | Year | Total | Less than 1 year | European Union - 27 countries (from 2020) | 2023 | 81.2 | bep |
Reviewed Eurostat observations; customised presentation, not an official Eurostat embed. Showing 4 of 50.
Eurostat dataset demo_mlexpec; Life expectancy by age and sex; updated 2026-06-04T23:00:00+0200.