Life satisfaction vs. life expectancy
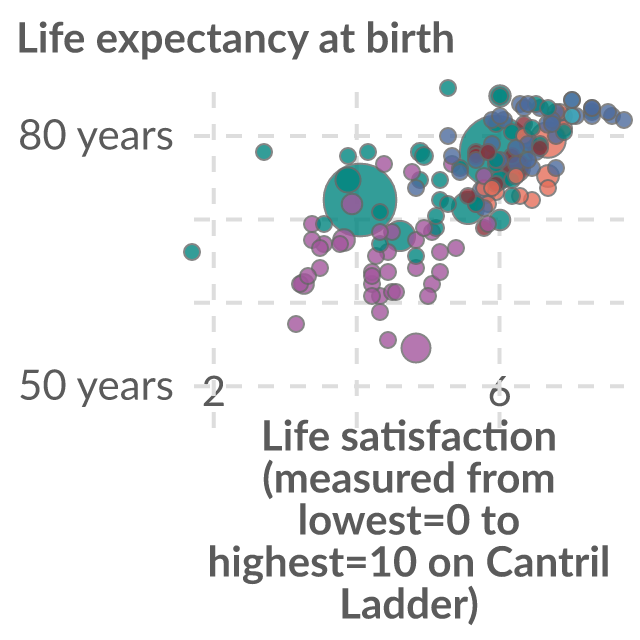
The vertical axis shows life expectancy at birth. The horizontal axis shows self-reported life satisfaction in the Cantril Ladder (0-10 point scale with higher values representing higher life satisfaction).
Where publishers find data.
Source links, freshness and reuse rights stay visible on every result.
The vertical axis shows life expectancy at birth. The horizontal axis shows self-reported life satisfaction in the Cantril Ladder (0-10 point scale with higher values representing higher life satisfaction).
The sex gap period life expectancy (females minus males), for people who have reached the age of 45. Positive values indicate higher life expectancy among females; negative values indicate higher life expectancy among males.
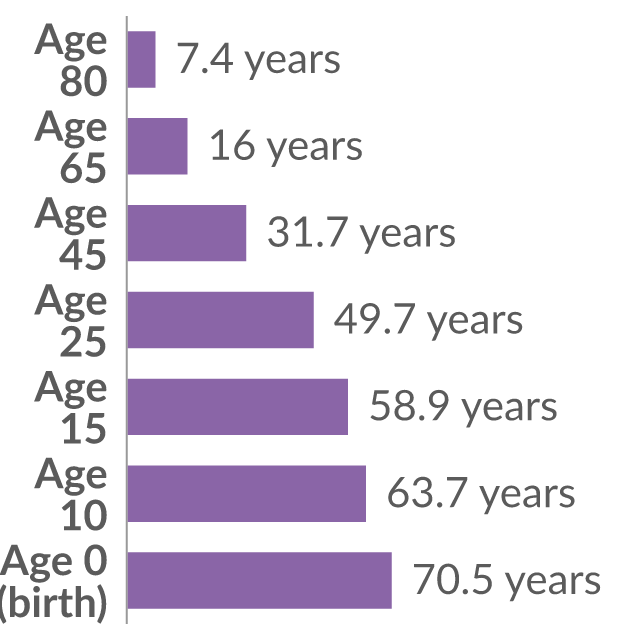
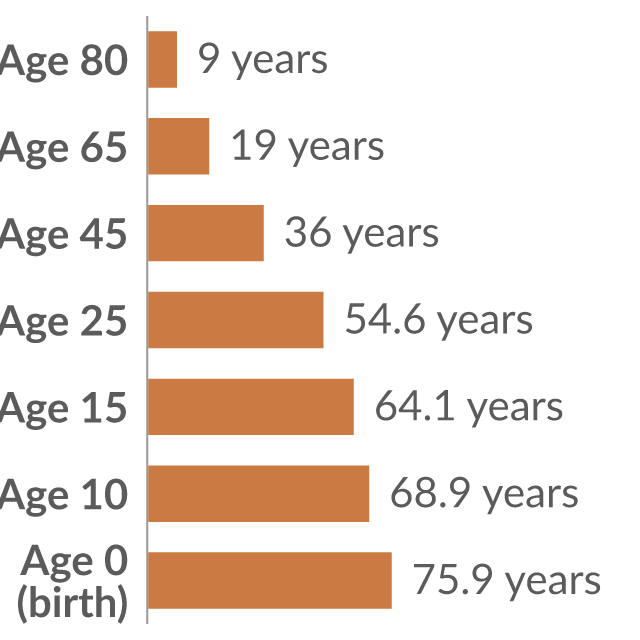
The remaining period life expectancy of people who have reached a given age.
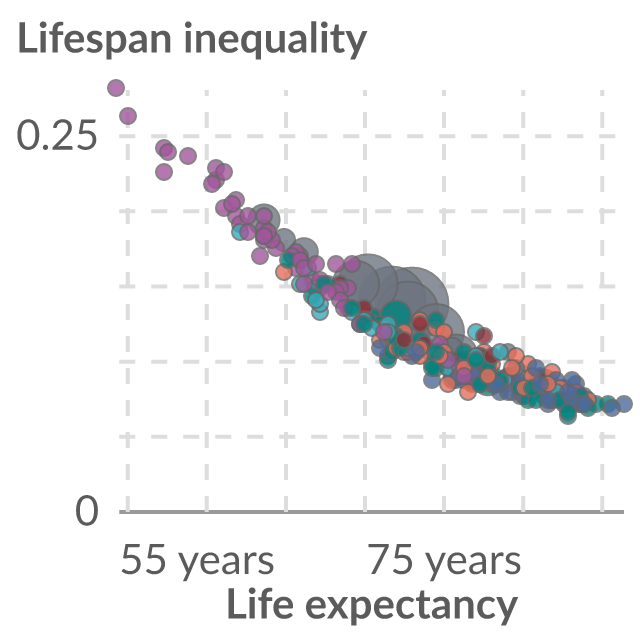
The period life expectancy at birth versus the Gini coefficient of lifespan inequality within a country, in females. A higher Gini coefficient indicates larger inequality in ages of death.
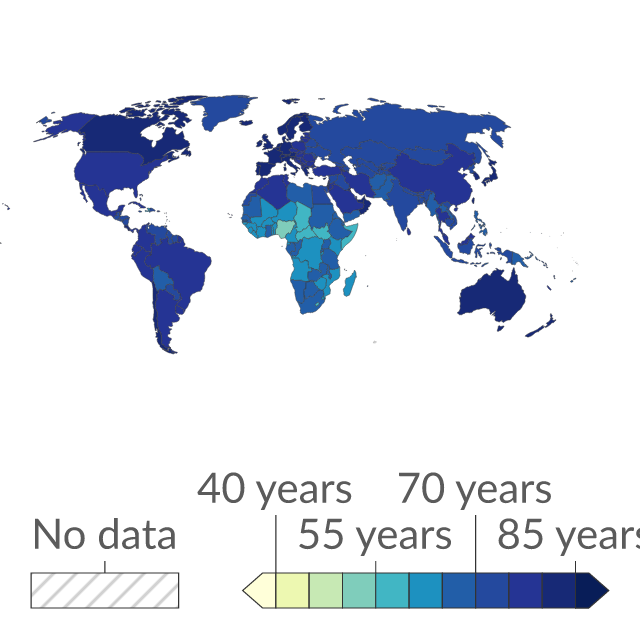
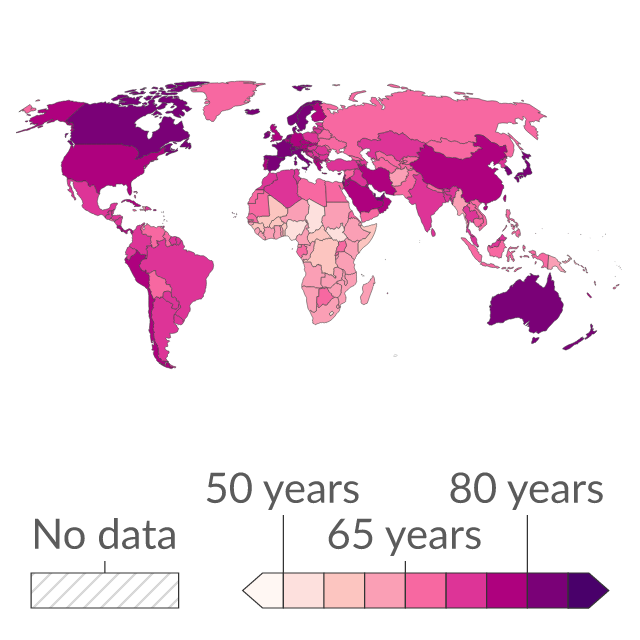
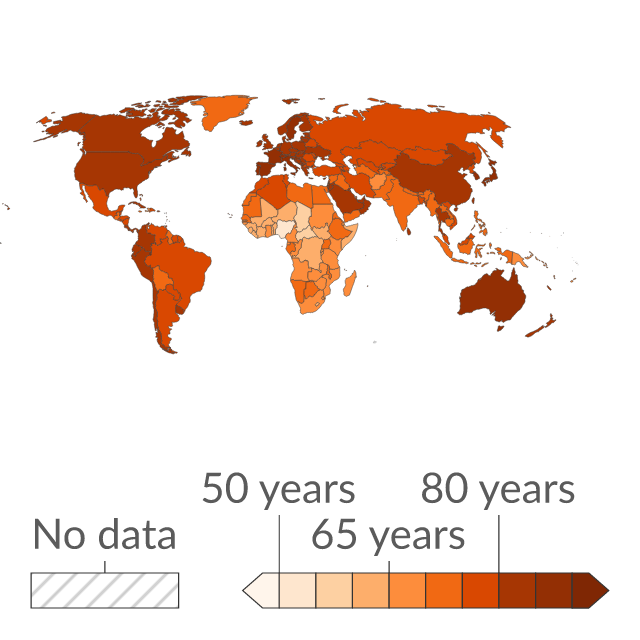
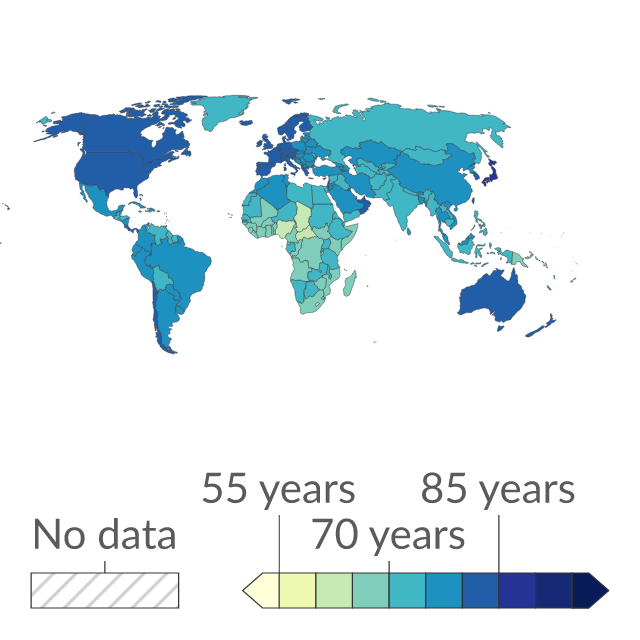
The period life expectancy is the age to which a newborn can expect to live, if age-specific mortality rates in the current year were to stay the same throughout their life.
| Time frequency | Unit of measure | Health and life expectancy | Sex | Geopolitical entity (reporting) | Time | Value | Flag |
|---|---|---|---|---|---|---|---|
| Annual | Year | Health expectancy in absolute values at birth | Total | European Union - 27 countries (from 2020) | 2020 | 74.5 | — |
| Annual | Year | Health expectancy in absolute values at birth | Total | European Union - 27 countries (from 2020) | 2021 | 74.3 | — |
| Annual | Year | Health expectancy in absolute values at birth | Total | European Union - 27 countries (from 2020) | 2022 | 74.8 | b |
| Annual | Year | Health expectancy in absolute values at birth | Total | European Union - 27 countries (from 2020) | 2023 | 75.3 | — |
Reviewed Eurostat observations; customised presentation, not an official Eurostat embed. Showing 4 of 45.
Eurostat dataset hlth_silc_17; Healthy life expectancy based on self-perceived health; updated 2026-06-25T23:00:00+0200.
| Time frequency | Unit of measure | Health and life expectancy | Sex | Geopolitical entity (reporting) | Time | Value | Flag |
|---|---|---|---|---|---|---|---|
| Annual | Year | Health expectancy in absolute values at birth | Total | European Union - 27 countries (from 2020) | 2020 | 74.5 | — |
| Annual | Year | Health expectancy in absolute values at birth | Total | European Union - 27 countries (from 2020) | 2021 | 74.3 | — |
| Annual | Year | Health expectancy in absolute values at birth | Total | European Union - 27 countries (from 2020) | 2022 | 74.8 | b |
| Annual | Year | Health expectancy in absolute values at birth | Total | European Union - 27 countries (from 2020) | 2023 | 75.3 | — |
Reviewed Eurostat observations; customised presentation, not an official Eurostat embed. Showing 4 of 15.
Eurostat dataset sdg_03_12; Healthy life expectancy based on self-perceived health; updated 2026-06-25T23:00:00+0200.
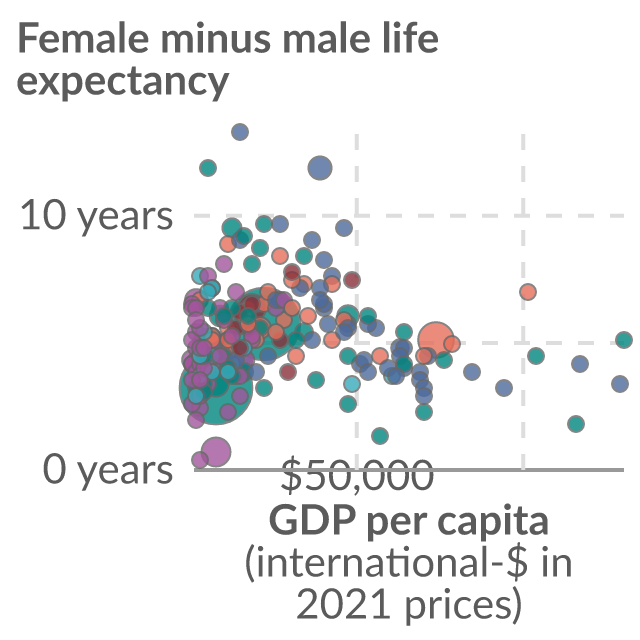
Female minus male life expectancy, in years. GDP per capita is adjusted for inflation and differences in living costs between countries.
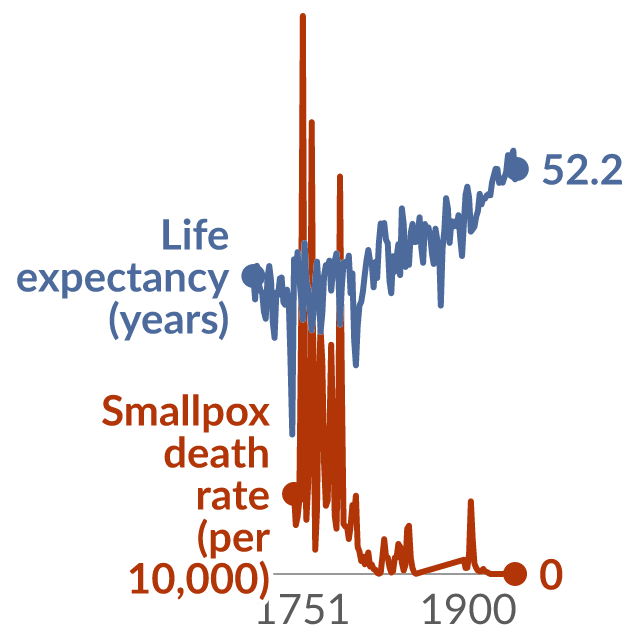
The period life expectancy at birth versus the smallpox death rate per 10,000 people in Sweden.
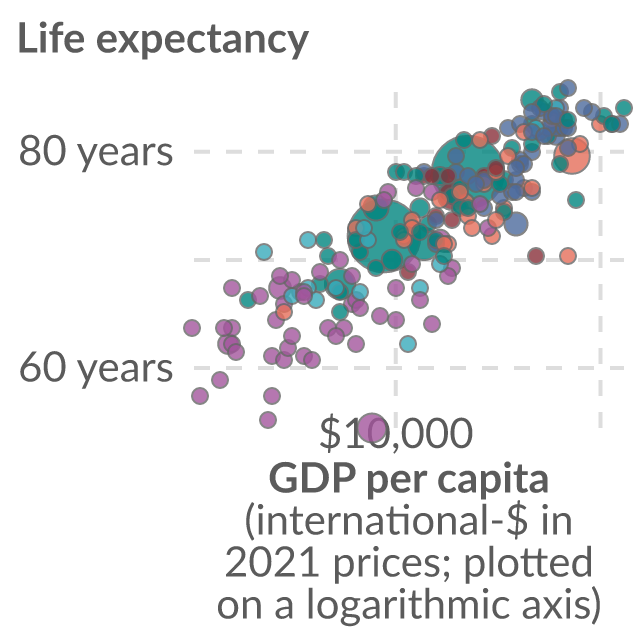
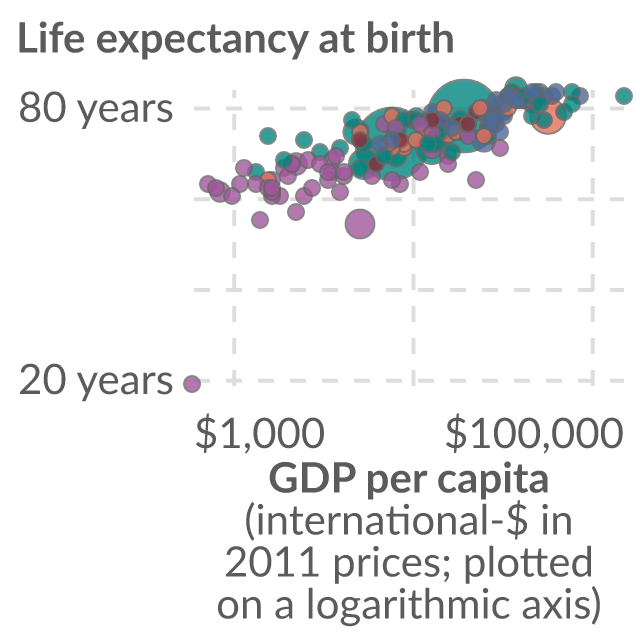
The period life expectancy at birth, in a given year. GDP per capita is adjusted for inflation and differences in living costs between countries.
The period life expectancy is the age to which a newborn boy can expect to live, if age-specific mortality rates in the current year were to stay the same throughout their life.
The period life expectancy is the age to which a newborn girl can expect to live, if age-specific mortality rates in the current year were to stay the same throughout their life.
The period life expectancy at birth, in a given year. GDP per capita is adjusted for inflation and differences in living costs between countries.
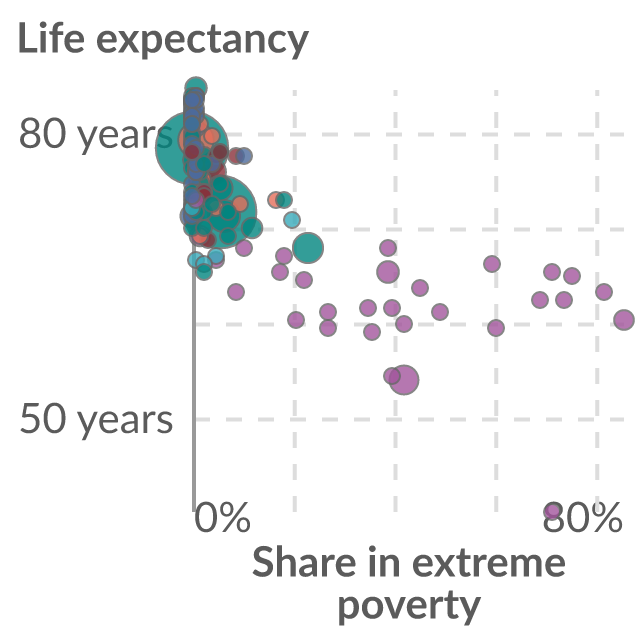
The period life expectancy at birth, in a given year. Extreme poverty is defined as living below the International Poverty Line of $3 per day.
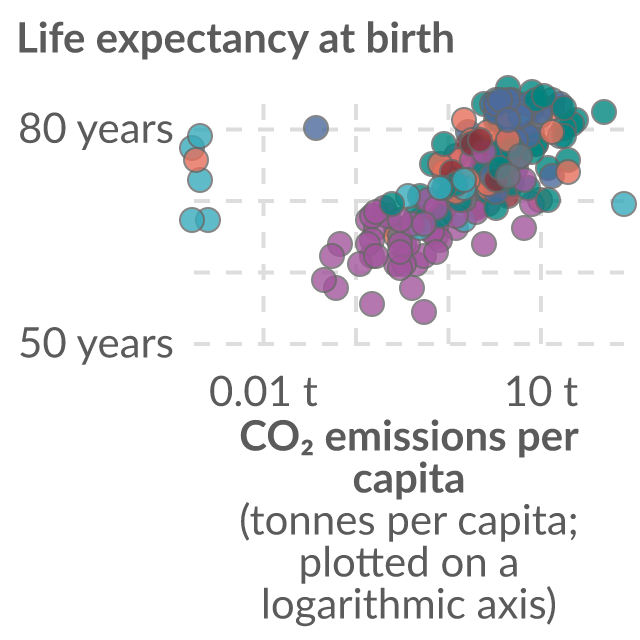
Average life expectancy at birth, measured in years across both sexes, versus carbon dioxide (CO₂) emissions per capita, measured in tonnes per person.
World Bank indicator SP.DYN.LE00.IN; latest fetched observation: 2025.
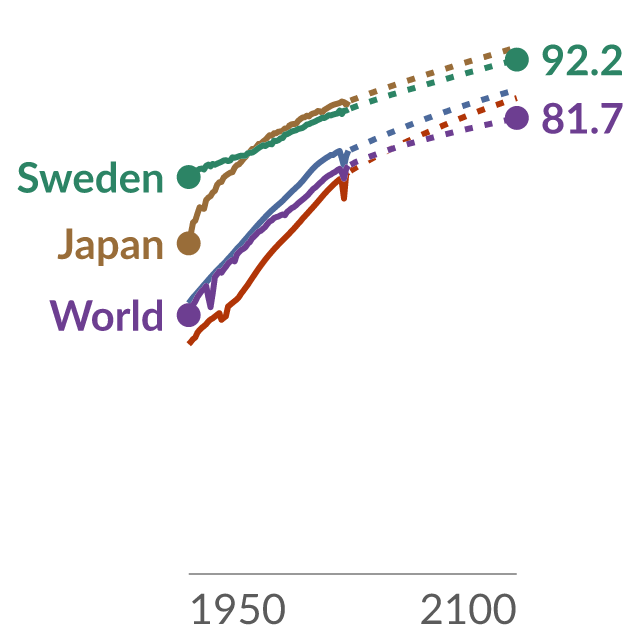
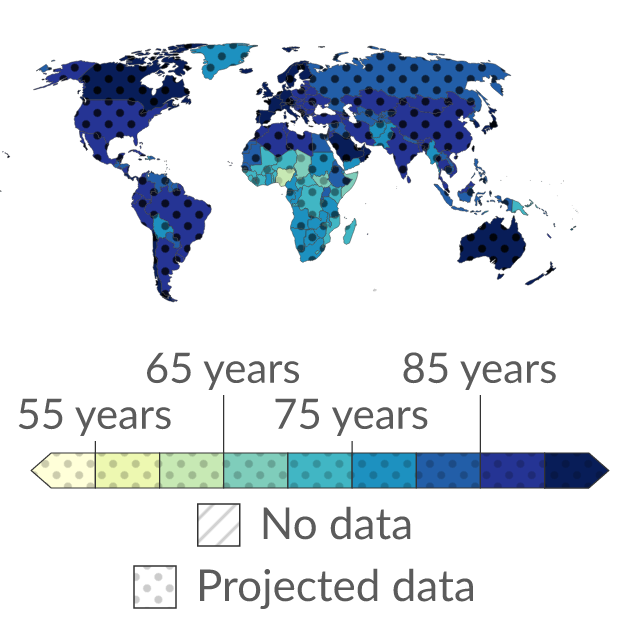
The period life expectancy is the age to which a newborn can expect to live, if age-specific mortality rates in the current year were to stay the same throughout their life. Future projections are based on the UN's medium scenario.
World Bank indicator SP.DYN.LE00.FE.IN; latest fetched observation: 2025.
World Bank indicator SP.DYN.LE00.MA.IN; latest fetched observation: 2025.
The period life expectancy is the age to which a newborn can expect to live, if age-specific mortality rates in the current year were to stay the same throughout their life. Future projections are based on the UN's medium scenario.
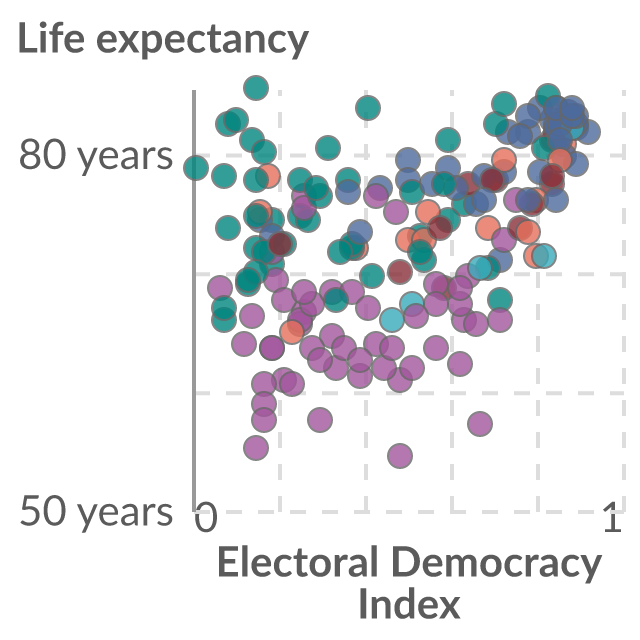
The period life expectancy at birth, in a given year. The electoral democracy index is by V-Dem, based on expert estimates, and ranges from 0 to 1 (most democratic).
The period life expectancy for people who have reached the age of 15, in a given year. From 2022 onwards, the UN WPP's mid-variant projections are shown.
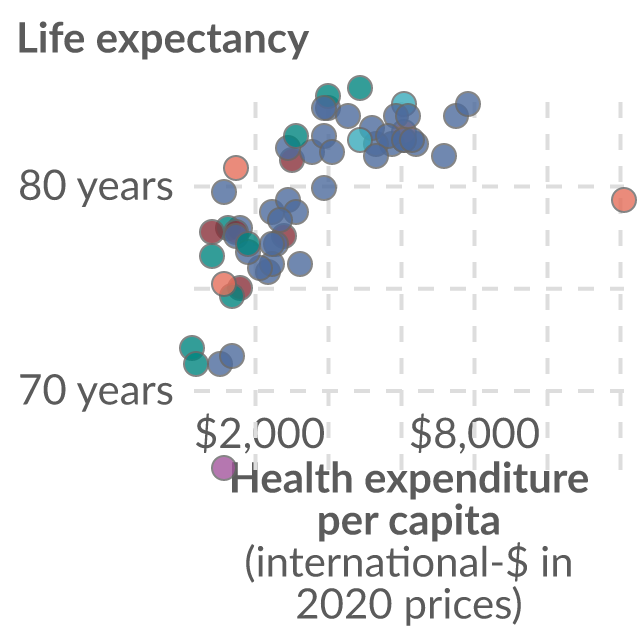
The period life expectancy at birth, in a given year. Health expenditure includes all financing schemes and covers all aspects of healthcare. This data is adjusted for inflation and differences in living costs between countries.