
PreviewSubmitted image
ChartOur World in Data
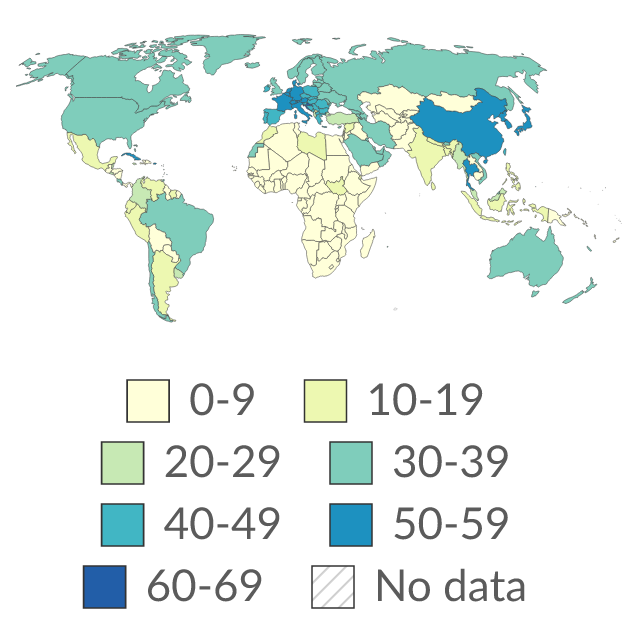
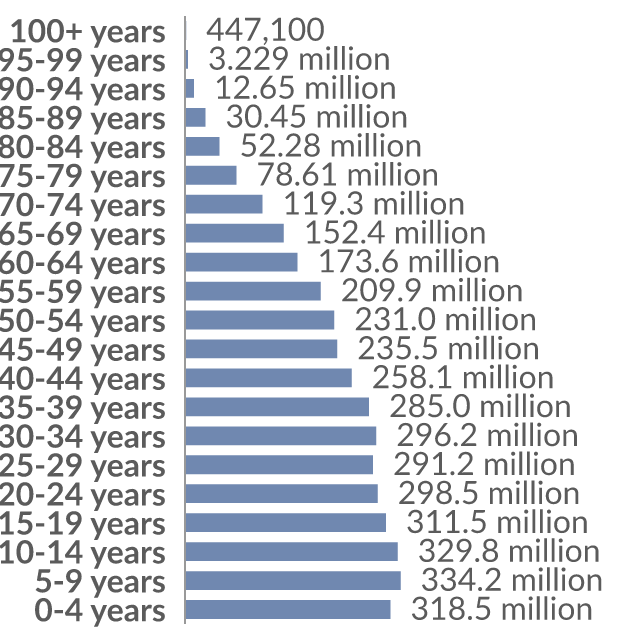
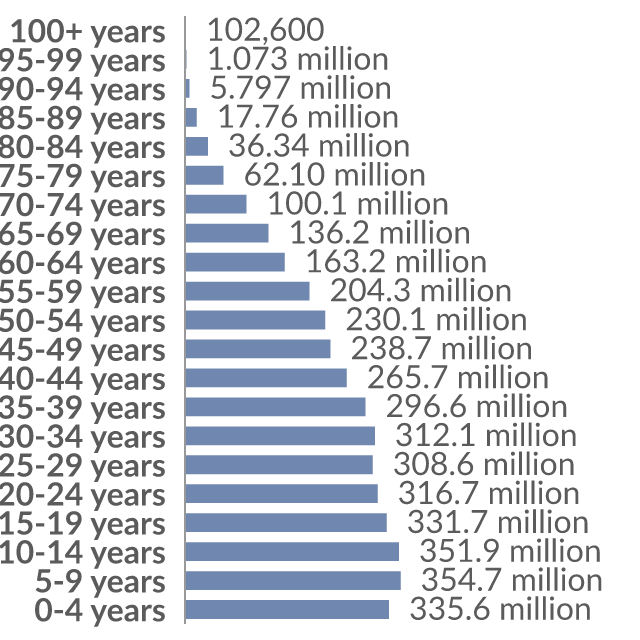
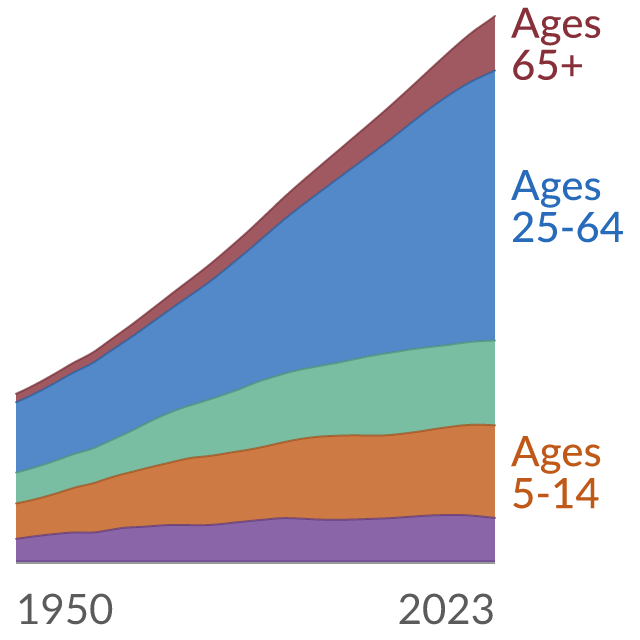
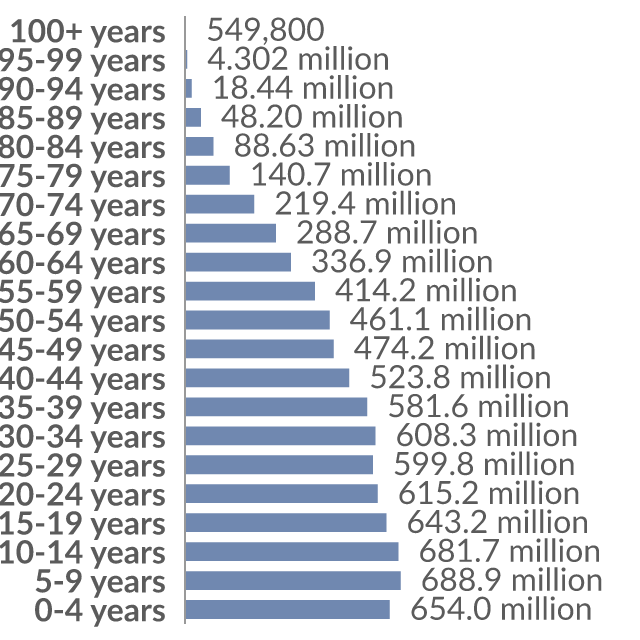
Age group with the largest population
Ten-year age group with the largest population.
Where publishers find data.
Source links, freshness and reuse rights stay visible on every result.
Ten-year age group with the largest population.
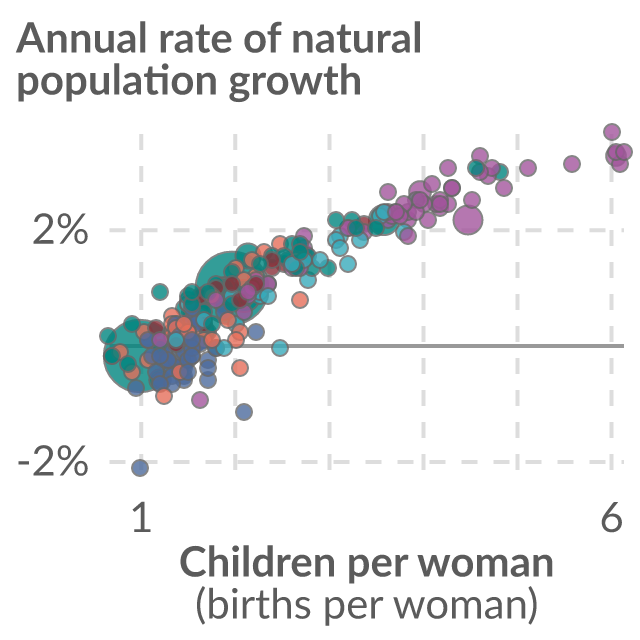
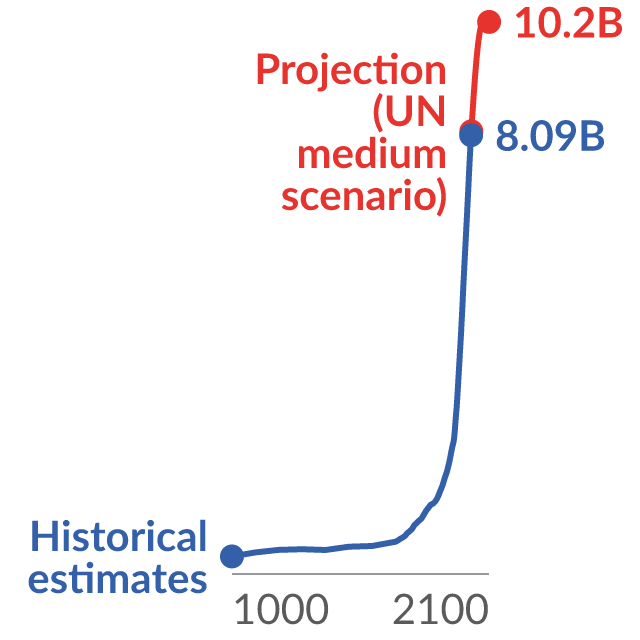
Natural population growth measures the population increase determined by births and deaths, excluding changes due to migration.

| Time frequency | Month | Live animals | Unit of measure | Geopolitical entity (reporting) | Time | Value | Flag |
|---|---|---|---|---|---|---|---|
| Annual | November - December | Live bovine animals | Thousand heads (animals) | European Union - 27 countries (from 2020) | 2020 | 76,551.1 | — |
| Annual | November - December | Live bovine animals | Thousand heads (animals) | European Union - 27 countries (from 2020) | 2021 | 75,705.3 | — |
| Annual | November - December | Live bovine animals | Thousand heads (animals) | European Union - 27 countries (from 2020) | 2022 | 74,807.63 | — |
| Annual | November - December | Live bovine animals | Thousand heads (animals) | European Union - 27 countries (from 2020) | 2023 | 73,761.43 | — |
Reviewed Eurostat observations; customised presentation, not an official Eurostat embed. Showing 4 of 50.
Eurostat dataset apro_mt_lscatl; Bovine population; updated 2026-07-15T11:00:00+0200.
| Time frequency | Unit of measure | Tenure status | Country/region of birth | Sex | Age class | Geopolitical entity (reporting) | Time | Value | Flag |
|---|---|---|---|---|---|---|---|---|---|
| Annual | Percentage | Owner | EU27 countries (from 2020) except reporting country | Total | From 18 to 54 years | European Union - 27 countries (from 2020) | 2020 | 38.3 | e |
| Annual | Percentage | Owner | EU27 countries (from 2020) except reporting country | Total | From 18 to 54 years | European Union - 27 countries (from 2020) | 2021 | 36.7 | — |
| Annual | Percentage | Owner | EU27 countries (from 2020) except reporting country | Total | From 18 to 54 years | European Union - 27 countries (from 2020) | 2022 | 37.6 | — |
| Annual | Percentage | Owner | EU27 countries (from 2020) except reporting country | Total | From 18 to 54 years | European Union - 27 countries (from 2020) | 2023 | 38 | — |
Reviewed Eurostat observations; customised presentation, not an official Eurostat embed. Showing 4 of 50.
Eurostat dataset ilc_lvps16; Distribution of population by group of country of birth and tenure status (population aged 18 and over); updated 2026-05-06T23:00:00+0200.
| Time frequency | Month | Live animals | Unit of measure | Geopolitical entity (reporting) | Time | Value | Flag |
|---|---|---|---|---|---|---|---|
| Annual | November - December | Live goats | Thousand heads (animals) | European Union - 27 countries (from 2020) | 2020 | 11,993.73 | e |
| Annual | November - December | Live goats | Thousand heads (animals) | European Union - 27 countries (from 2020) | 2021 | 11,743.98 | e |
| Annual | November - December | Live goats | Thousand heads (animals) | European Union - 27 countries (from 2020) | 2022 | 11,308.91 | — |
| Annual | November - December | Live goats | Thousand heads (animals) | European Union - 27 countries (from 2020) | 2023 | 10,659.51 | e |
Reviewed Eurostat observations; customised presentation, not an official Eurostat embed. Showing 4 of 6.
Eurostat dataset apro_mt_lsgoat; Goats population; updated 2026-07-31T23:00:00+0200.
| Time frequency | Month | Live animals | Unit of measure | Geopolitical entity (reporting) | Time | Value | Flag |
|---|---|---|---|---|---|---|---|
| Annual | November - December | Live swine, domestic species | Thousand heads (animals) | European Union - 27 countries (from 2020) | 2020 | 145,918.6 | — |
| Annual | November - December | Live swine, domestic species | Thousand heads (animals) | European Union - 27 countries (from 2020) | 2021 | 141,681.38 | — |
| Annual | November - December | Live swine, domestic species | Thousand heads (animals) | European Union - 27 countries (from 2020) | 2022 | 134,410.04 | — |
| Annual | November - December | Live swine, domestic species | Thousand heads (animals) | European Union - 27 countries (from 2020) | 2023 | 132,845.67 | — |
Reviewed Eurostat observations; customised presentation, not an official Eurostat embed. Showing 4 of 50.
Eurostat dataset apro_mt_lspig; Pig population; updated 2026-07-15T11:00:00+0200.
| Time frequency | Demographic indicator | Geopolitical entity (reporting) | Time | Value | Flag |
|---|---|---|---|---|---|
| Annual | Population on 1 January - total | European Union - 27 countries (from 2020) | 2020 | 446,923,963 | e |
| Annual | Population on 1 January - total | European Union - 27 countries (from 2020) | 2021 | 445,767,723 | b |
| Annual | Population on 1 January - total | European Union - 27 countries (from 2020) | 2022 | 445,999,571 | e |
| Annual | Population on 1 January - total | European Union - 27 countries (from 2020) | 2023 | 447,805,685 | be |
Reviewed Eurostat observations; customised presentation, not an official Eurostat embed. Showing 4 of 7.
Eurostat dataset tps00001; Population on 1 January; updated 2026-07-21T23:00:00+0200.
| Time frequency | Month | Live animals | Unit of measure | Geopolitical entity (reporting) | Time | Value | Flag |
|---|---|---|---|---|---|---|---|
| Annual | November - December | Live sheep | Thousand heads (animals) | European Union - 27 countries (from 2020) | 2020 | 61,462.17 | e |
| Annual | November - December | Live sheep | Thousand heads (animals) | European Union - 27 countries (from 2020) | 2021 | 60,450.61 | e |
| Annual | November - December | Live sheep | Thousand heads (animals) | European Union - 27 countries (from 2020) | 2022 | 59,158.95 | — |
| Annual | November - December | Live sheep | Thousand heads (animals) | European Union - 27 countries (from 2020) | 2023 | 57,513.88 | e |
Reviewed Eurostat observations; customised presentation, not an official Eurostat embed. Showing 4 of 9.
Eurostat dataset apro_mt_lssheep; Sheep population; updated 2026-07-31T23:00:00+0200.
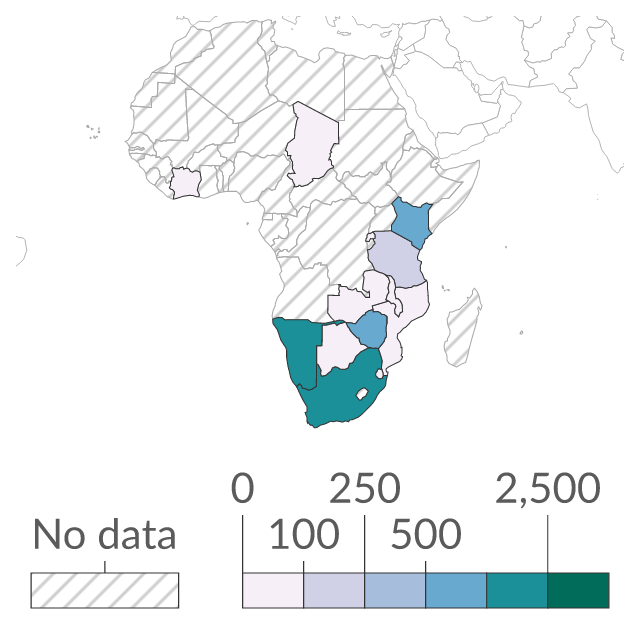
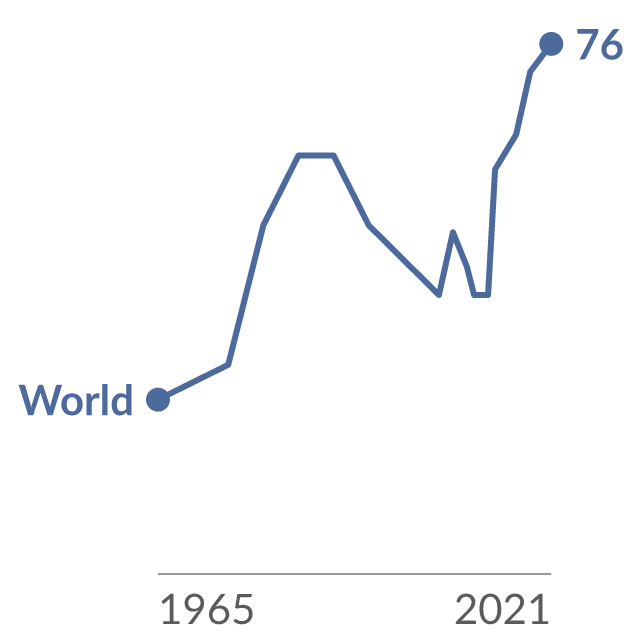
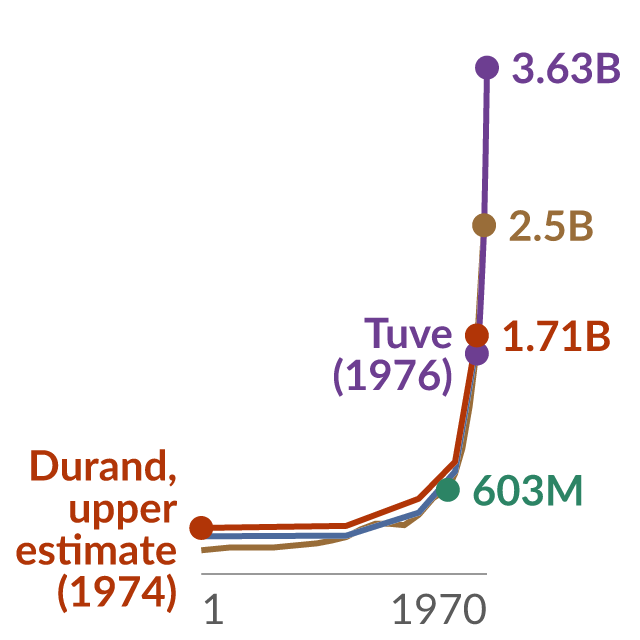
World Bank indicator EN.POP.EL5M.ZS; latest fetched observation: 2025.
| Time frequency | Territorial typology | Geopolitical entity (reporting) | Time | Value | Flag |
|---|---|---|---|---|---|
| Annual | Predominantly urban regions | European Union - 27 countries (from 2020) | 2020 | 452 | e |
| Annual | Predominantly urban regions | European Union - 27 countries (from 2020) | 2021 | 449 | bep |
| Annual | Predominantly urban regions | European Union - 27 countries (from 2020) | 2022 | 450 | bep |
| Annual | Predominantly urban regions | European Union - 27 countries (from 2020) | 2023 | 454 | bep |
Reviewed Eurostat observations; customised presentation, not an official Eurostat embed. Showing 4 of 50.
Eurostat dataset urt_d3dens; Population density by other typologies; updated 2024-03-14T23:00:00+0100.
World Bank indicator EN.URB.MCTY.TL.ZS; latest fetched observation: 2025.
World Bank indicator EN.POP.EL5M.RU.ZS; latest fetched observation: 2025.
World Bank indicator EN.POP.EL5M.UR.ZS; latest fetched observation: 2025.
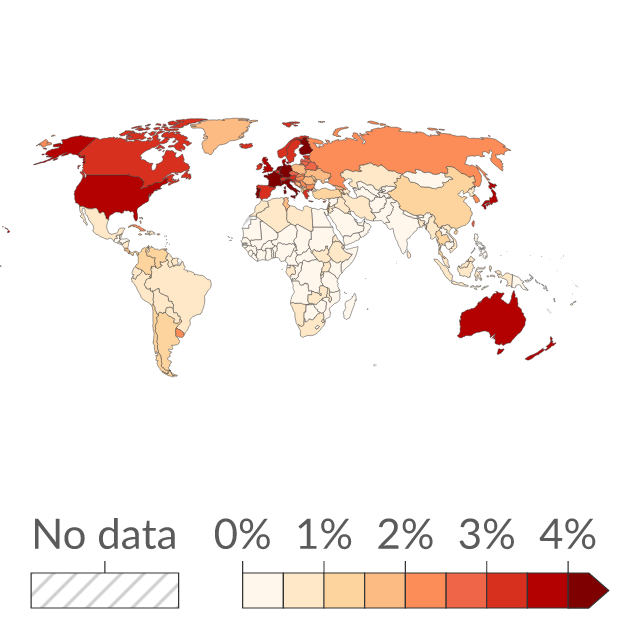
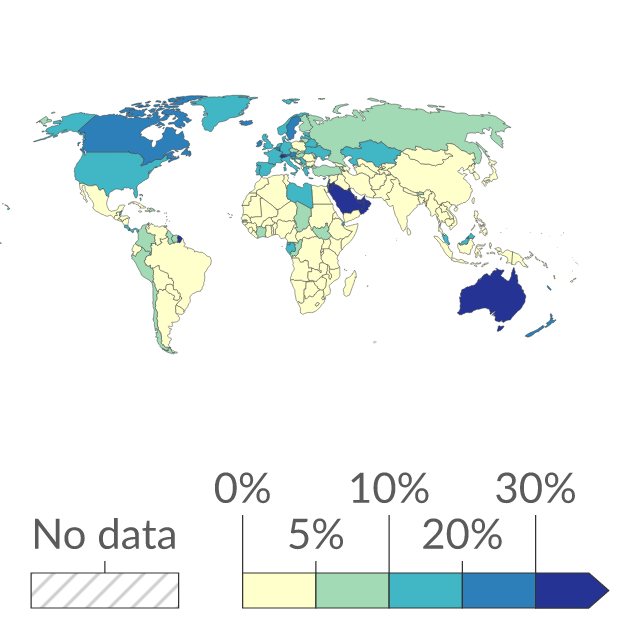
The estimated share of population with any form of cancer.