Where publishers find data.

Results for “agriculture”

Source links, freshness and reuse rights stay visible on every result.

Page 3 · 24 results
Filters
FiltersClear
Asset type
Source
Commercial use
Rights review
Freshness
Data previewapri_lprc
Reviewed data preview from apri_lprc
Time frequencyUnit of measureAgricultural productsGeopolitical entity (reporting)TimeValueFlag
AnnualEuro per hectareArable landEuropean Union - 27 countries (from 2020)202012,361e
AnnualEuro per hectareArable landEuropean Union - 27 countries (from 2020)202112,870e
AnnualEuro per hectareArable landEuropean Union - 27 countries (from 2020)202214,014e
AnnualEuro per hectareArable landEuropean Union - 27 countries (from 2020)202314,343e

Reviewed Eurostat observations; customised presentation, not an official Eurostat embed. Showing 4 of 10.

DatasetEurostat

Agricultural land prices by region

Eurostat dataset apri_lprc; Agricultural land prices by region; updated 2026-07-10T23:00:00+0200.
Source
Eurostat
Updated
10 Jul 2026
Data previewef_lf_leg
Reviewed data preview from ef_lf_leg
Time frequencyStatistical informationLabour force and employment statusLegal formStandard output in EurosSexUnit of measureGeopolitical entity (reporting)TimeValue
AnnualAbove thresholdTotalTotalTotalTotalAnnual working unit (AWU)European Union - 27 countries (from 2020)20207,112,420
AnnualAbove thresholdTotalTotalTotalTotalAnnual working unit (AWU)European Union - 27 countries (from 2020)20236,876,570
AnnualAbove thresholdTotalTotalTotalTotalPersonEuropean Union - 27 countries (from 2020)202013,175,540
AnnualAbove thresholdTotalTotalTotalTotalPersonEuropean Union - 27 countries (from 2020)202312,517,440

Reviewed Eurostat observations; customised presentation, not an official Eurostat embed. Showing 4 of 50.

DatasetEurostat

Agricultural labour force by legal entity, work status and sex of worker, economic size of the agricultural holding and NUTS 2 region

Eurostat dataset ef_lf_leg; Agricultural labour force by legal entity, work status and sex of worker, economic size of the agricultural holding and NUTS 2 region; updated 2026-06-17T23:00:00+0200.

Source
Eurostat
Updated
17 Jun 2026
PreviewSubmitted image
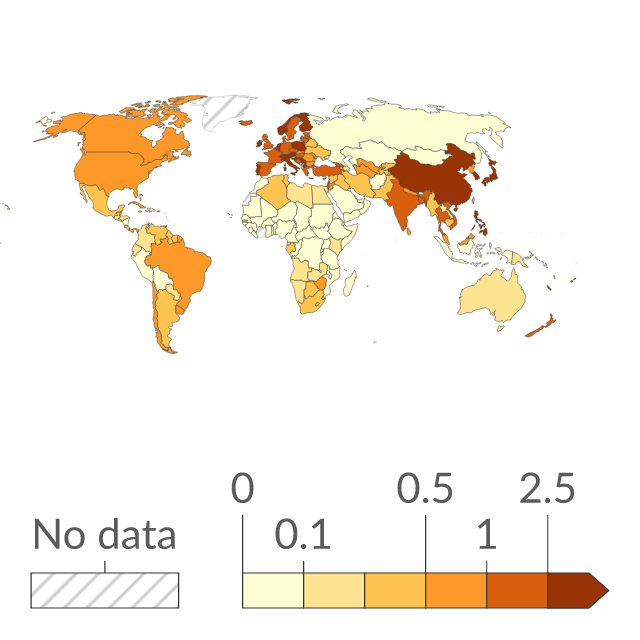
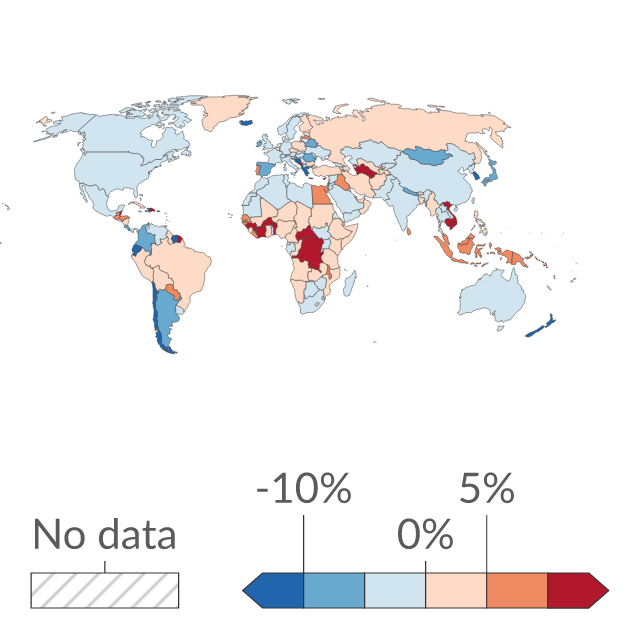
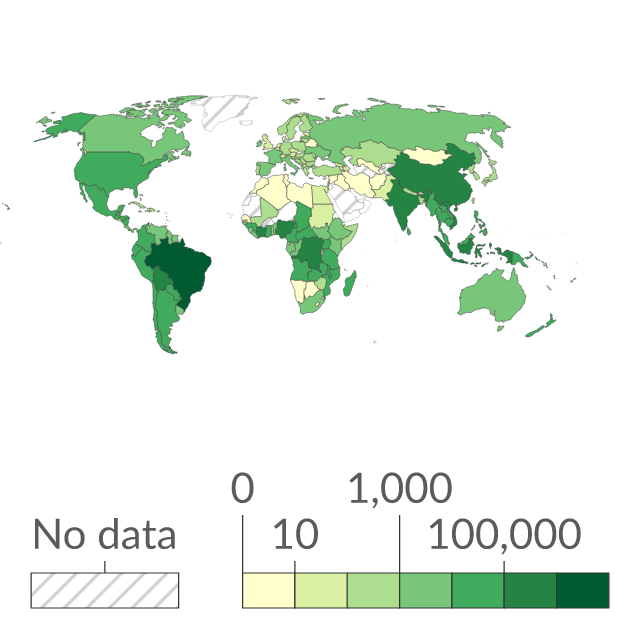
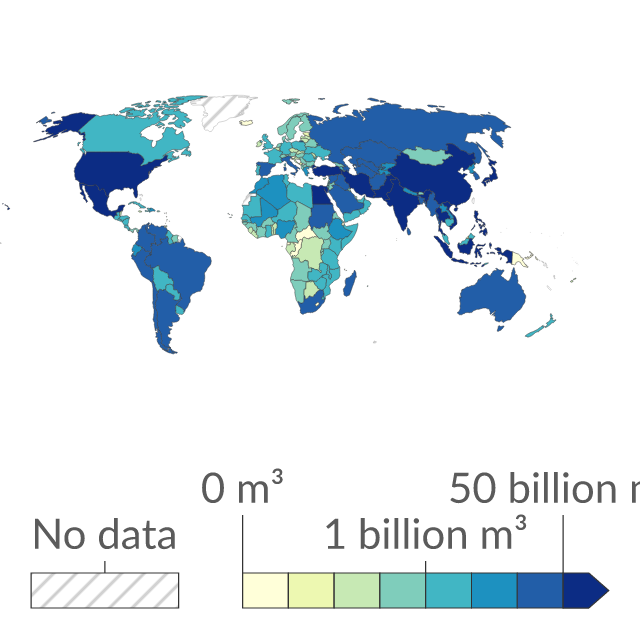
Preview of Agricultural water withdrawals
ChartOur World in Data

Agricultural water withdrawals

Total agricultural withdrawals, measured in m³ per year. Agricultural water is defined as the annual quantity of self-supplied water withdrawn for irrigation, livestock and aquaculture purposes.

Source
Our World in Data
Updated
07 Aug 2026
Data previewef_lf_main
Reviewed data preview from ef_lf_main
Time frequencyStatistical informationFarm typeAge classSexUnit of measureLabour force and employment statusGeopolitical entity (reporting)TimeValue
AnnualAbove thresholdTotalTotalTotalAnnual working unit (AWU)TotalEuropean Union - 27 countries (from 2020)20207,112,420
AnnualAbove thresholdTotalTotalTotalAnnual working unit (AWU)TotalEuropean Union - 27 countries (from 2020)20236,876,570
AnnualAbove thresholdTotalTotalTotalAnnual working unit (AWU)Farm labour force, directly employed by the farm on a regular basisEuropean Union - 27 countries (from 2020)20206,237,140
AnnualAbove thresholdTotalTotalTotalAnnual working unit (AWU)Farm labour force, directly employed by the farm on a regular basisEuropean Union - 27 countries (from 2020)20236,027,160

Reviewed Eurostat observations; customised presentation, not an official Eurostat embed. Showing 4 of 50.

DatasetEurostat

Main agricultural labour force by age and sex of the farm manager, farm type of the agricultural holding and NUTS 2 region

Eurostat dataset ef_lf_main; Main agricultural labour force by age and sex of the farm manager, farm type of the agricultural holding and NUTS 2 region; updated 2026-06-17T23:00:00+0200.

Source
Eurostat
Updated
17 Jun 2026
Data previewef_fsi_tenure
Reviewed data preview from ef_fsi_tenure
Time frequencyUtilised agricultural areaAge classTenure statusUnit of measureGeopolitical entity (reporting)TimeValueFlag
AnnualTotalTotalTotalHectareEuropean Union - 27 countries (from 2020)2020157,414,160—
AnnualTotalTotalTotalHectareEuropean Union - 27 countries (from 2020)2023156,225,270i
AnnualTotalTotalTotalLivestock unit (LSU)European Union - 27 countries (from 2020)2020116,514,520—
AnnualTotalTotalTotalLivestock unit (LSU)European Union - 27 countries (from 2020)2023109,593,980i

Reviewed Eurostat observations; customised presentation, not an official Eurostat embed. Showing 4 of 50.

DatasetEurostat

Tenure of utilised agricultural area

Eurostat dataset ef_fsi_tenure; Tenure of utilised agricultural area; updated 2026-08-06T11:00:00+0200.

Source
Eurostat
Updated
06 Aug 2026
Data previewef_fsi_farms
Reviewed data preview from ef_fsi_farms
Time frequencyUtilised agricultural areaUnit of measureGeopolitical entity (reporting)TimeValueFlag
AnnualTotalHoldingEuropean Union - 27 countries (from 2020)20209,070,950—
AnnualTotalHoldingEuropean Union - 27 countries (from 2020)20238,768,130i
AnnualTotalPercentageEuropean Union - 27 countries (from 2020)2020100—
AnnualTotalPercentageEuropean Union - 27 countries (from 2020)2023100i

Reviewed Eurostat observations; customised presentation, not an official Eurostat embed. Showing 4 of 44.

DatasetEurostat

Farms by utilised agricultural area

Eurostat dataset ef_fsi_farms; Farms by utilised agricultural area; updated 2026-06-17T23:00:00+0200.

Source
Eurostat
Updated
17 Jun 2026
Data previewtag00046
Reviewed data preview from tag00046
Time frequencyAgro-monetary itemsPrice adjustmentUnit of measureGeopolitical entity (reporting)TimeValue
AnnualAgricultural goods, including fruit and vegetablesNominal indexIndex, 2020=100European Union - 27 countries (from 2020)202099.99
AnnualAgricultural goods, including fruit and vegetablesNominal indexIndex, 2020=100European Union - 27 countries (from 2020)2021109.49
AnnualAgricultural goods, including fruit and vegetablesNominal indexIndex, 2020=100European Union - 27 countries (from 2020)2022138.89
AnnualAgricultural goods, including fruit and vegetablesNominal indexIndex, 2020=100European Union - 27 countries (from 2020)2023139.76

Reviewed Eurostat observations; customised presentation, not an official Eurostat embed. Showing 4 of 12.

DatasetEurostat

Producer price indices, total agricultural production

Eurostat dataset tag00046; Producer price indices, total agricultural production; updated 2026-09-10T11:00:00+0200.

Source
Eurostat
Updated
10 Sept 2026
Data previewef_fsi_training
Reviewed data preview from ef_fsi_training
Time frequencyTrainingAge classUnit of measureGeopolitical entity (reporting)TimeValueFlag
AnnualTotalTotalHoldingEuropean Union - 27 countries (from 2020)20209,070,950—
AnnualTotalTotalHoldingEuropean Union - 27 countries (from 2020)20238,768,130i
AnnualTotalTotalPercentageEuropean Union - 27 countries (from 2020)2020100—
AnnualTotalTotalPercentageEuropean Union - 27 countries (from 2020)2023100i

Reviewed Eurostat observations; customised presentation, not an official Eurostat embed. Showing 4 of 50.

DatasetEurostat

Agricultural training of farm managers

Eurostat dataset ef_fsi_training; Agricultural training of farm managers; updated 2026-06-17T23:00:00+0200.

Source
Eurostat
Updated
17 Jun 2026
Data previewtag00125
Reviewed data preview from tag00125
Time frequencyStandard output in EurosSexAge classUnit of measureGeopolitical entity (reporting)TimeValueFlag
AnnualTotalTotalTotalHoldingEuropean Union - 27 countries (from 2020)20209,070,950—
AnnualTotalTotalTotalHoldingEuropean Union - 27 countries (from 2020)20238,771,680i
AnnualTotalTotalLess than 25 yearsHoldingEuropean Union - 27 countries (from 2020)202072,810—
AnnualTotalTotalLess than 25 yearsHoldingEuropean Union - 27 countries (from 2020)202349,740i

Reviewed Eurostat observations; customised presentation, not an official Eurostat embed. Showing 4 of 18.

DatasetEurostat

Agricultural holdings by age of manager

Eurostat dataset tag00125; Agricultural holdings by age of manager; updated 2026-06-17T23:00:00+0200.

Source
Eurostat
Updated
17 Jun 2026
PreviewSubmitted image
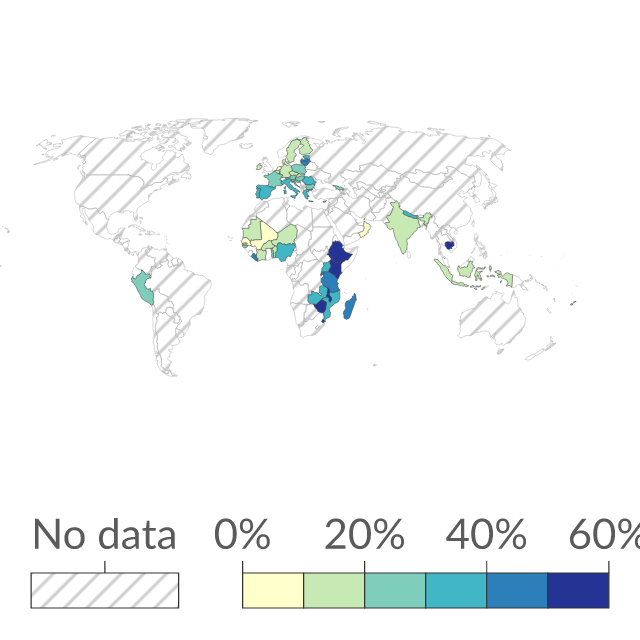
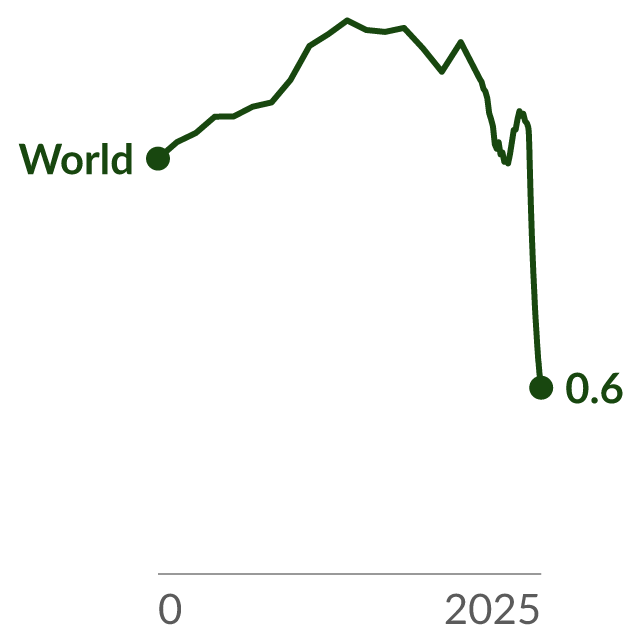
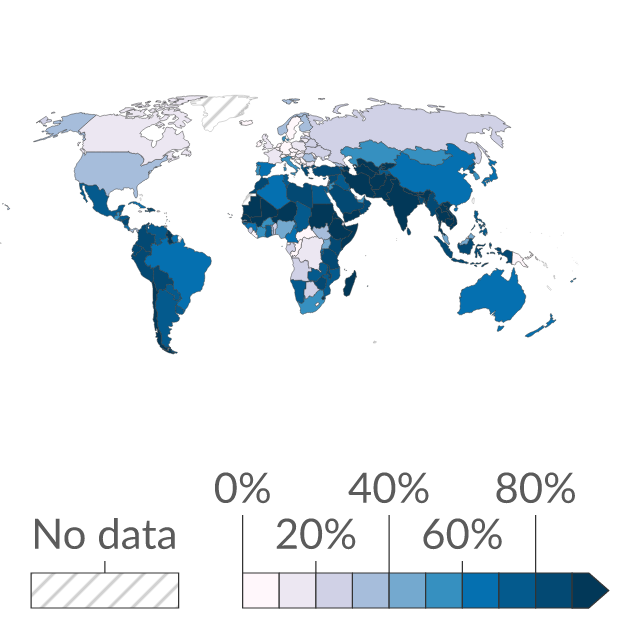
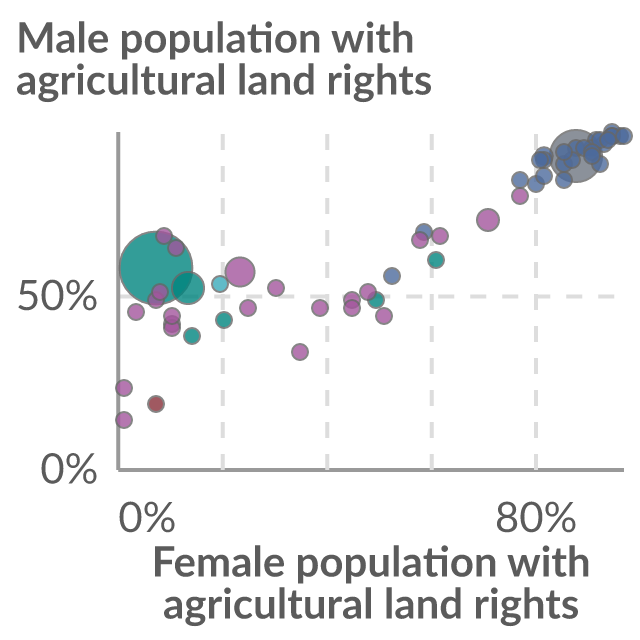
Preview of Share of agricultural population with land rights, by sex
ChartOur World in Data

Share of agricultural population with land rights, by sex

The agricultural population refers to the number of adult individuals living in a household where at least one person operates land for agricultural purposes or raises livestock. Secure tenure rights over land include agricultural land ownership and the right to sell or bequeath agricultural land.

Source
Our World in Data
Updated
31 Jul 2026
Data previewsdg_02_30
Reviewed data preview from sdg_02_30
Time frequencyNomenclature for the analysis and comparison of scientific programmes and budgets (NABS 2007)Unit of measureGeopolitical entity (reporting)TimeValueFlag
AnnualAgricultureMillion euroEuropean Union - 27 countries (from 2020)20203,217.924e
AnnualAgricultureMillion euroEuropean Union - 27 countries (from 2020)20213,337.687e
AnnualAgricultureMillion euroEuropean Union - 27 countries (from 2020)20223,576.573e
AnnualAgricultureMillion euroEuropean Union - 27 countries (from 2020)20233,694.162—

Reviewed Eurostat observations; customised presentation, not an official Eurostat embed. Showing 4 of 12.

DatasetEurostat

Government support to agricultural research and development

Eurostat dataset sdg_02_30; Government support to agricultural research and development; updated 2026-08-06T23:00:00+0200.

Source
Eurostat
Updated
06 Aug 2026
Data previewtag00057
Reviewed data preview from tag00057
Time frequencyAgricultural indicatorsUnit of measureGeopolitical entity (reporting)TimeValueFlag
AnnualIndicator A - index of the real income of factors in agriculture per annual work unitIndex, 2020=100European Union - 27 countries (from 2020)2020100—
AnnualIndicator A - index of the real income of factors in agriculture per annual work unitIndex, 2020=100European Union - 27 countries (from 2020)2021104.96—
AnnualIndicator A - index of the real income of factors in agriculture per annual work unitIndex, 2020=100European Union - 27 countries (from 2020)2022119.03—
AnnualIndicator A - index of the real income of factors in agriculture per annual work unitIndex, 2020=100European Union - 27 countries (from 2020)2023111.37—

Reviewed Eurostat observations; customised presentation, not an official Eurostat embed. Showing 4 of 6.

DatasetEurostat

Indicator A of the income from agricultural activity

Eurostat dataset tag00057; Indicator A of the income from agricultural activity; updated 2026-06-25T11:00:00+0200.

Source
Eurostat
Updated
25 Jun 2026
Data previewapri_pi_outa
Reviewed data preview from apri_pi_outa
Time frequencyAgro-monetary itemsPrice adjustmentUnit of measureGeopolitical entity (reporting)TimeValueFlag
AnnualCereals (including seeds)Nominal indexIndex, 2020=100European Union - 27 countries (from 2020)202099.98—
AnnualCereals (including seeds)Nominal indexIndex, 2020=100European Union - 27 countries (from 2020)2021128.65—
AnnualCereals (including seeds)Nominal indexIndex, 2020=100European Union - 27 countries (from 2020)2022187.55—
AnnualCereals (including seeds)Nominal indexIndex, 2020=100European Union - 27 countries (from 2020)2023139.56—

Reviewed Eurostat observations; customised presentation, not an official Eurostat embed. Showing 4 of 50.

DatasetEurostat

Price indices of agricultural products, output - annual data

Eurostat dataset apri_pi_outa; Price indices of agricultural products, output - annual data; updated 2026-09-10T11:00:00+0200.

Source
Eurostat
Updated
10 Sept 2026
Data previewapri_pi_outq
Reviewed data preview from apri_pi_outq
Time frequencyAgro-monetary itemsPrice adjustmentUnit of measureGeopolitical entity (reporting)TimeValue
QuarterlyCereals (including seeds)Nominal indexIndex, 2020=100European Union - 27 countries (from 2020)2020-Q198.05
QuarterlyCereals (including seeds)Nominal indexIndex, 2020=100European Union - 27 countries (from 2020)2020-Q299.69
QuarterlyCereals (including seeds)Nominal indexIndex, 2020=100European Union - 27 countries (from 2020)2020-Q397.57
QuarterlyCereals (including seeds)Nominal indexIndex, 2020=100European Union - 27 countries (from 2020)2020-Q4104.84

Reviewed Eurostat observations; customised presentation, not an official Eurostat embed. Showing 4 of 50.

DatasetEurostat

Price indices of agricultural products, output - quarterly data

Eurostat dataset apri_pi_outq; Price indices of agricultural products, output - quarterly data; updated 2026-09-10T11:00:00+0200.

Source
Eurostat
Updated
10 Sept 2026
Data previewtag00102
Reviewed data preview from tag00102
Time frequencyAgro-monetary itemsAgricultural indicatorsUnit of measureGeopolitical entity (reporting)TimeValueFlag
AnnualOutput of the agricultural 'industry'Production value at basic priceMillion euroEuropean Union - 27 countries (from 2020)2020414,936.34—
AnnualOutput of the agricultural 'industry'Production value at basic priceMillion euroEuropean Union - 27 countries (from 2020)2021451,796.81—
AnnualOutput of the agricultural 'industry'Production value at basic priceMillion euroEuropean Union - 27 countries (from 2020)2022541,764.49—
AnnualOutput of the agricultural 'industry'Production value at basic priceMillion euroEuropean Union - 27 countries (from 2020)2023536,771.4—

Reviewed Eurostat observations; customised presentation, not an official Eurostat embed. Showing 4 of 12.

DatasetEurostat

Output of the agricultural industry - basic and producer prices

Eurostat dataset tag00102; Output of the agricultural industry - basic and producer prices; updated 2026-05-13T11:00:00+0200.

Source
Eurostat
Updated
13 May 2026
Data previeworg_cropar
Reviewed data preview from org_cropar
Time frequencyUnit of measureCropsAgricultural production methodsGeopolitical entity (reporting)TimeValueFlag
AnnualHectareUtilised agricultural area excluding kitchen gardensTotal fully converted and under conversion to organic farmingEuropean Union - 27 countries (from 2020)202014,724,279e
AnnualHectareArable landTotal fully converted and under conversion to organic farmingEuropean Union - 27 countries (from 2020)20206,800,551e
AnnualHectarePermanent grasslandTotal fully converted and under conversion to organic farmingEuropean Union - 27 countries (from 2020)20206,245,148e
AnnualHectarePermanent cropsTotal fully converted and under conversion to organic farmingEuropean Union - 27 countries (from 2020)20201,678,581e

Reviewed Eurostat observations; customised presentation, not an official Eurostat embed. Showing 4 of 5.

DatasetEurostat

Organic crop area by agricultural production methods and crops

Eurostat dataset org_cropar; Organic crop area by agricultural production methods and crops; updated 2026-08-07T23:00:00+0200.

Source
Eurostat
Updated
07 Aug 2026