
PreviewSubmitted image
ChartOur World in Data
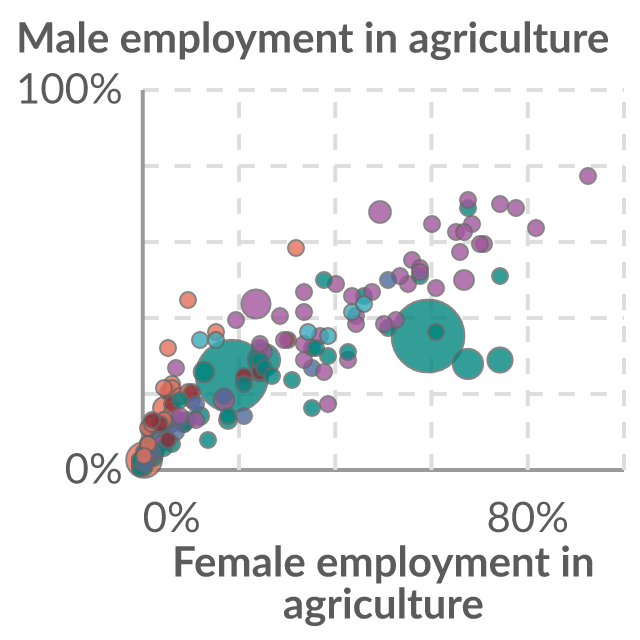
Share of male vs. female employment in agriculture
The agriculture sector consists of activities in agriculture, hunting, forestry and fishing.
Where publishers find data.
Source links, freshness and reuse rights stay visible on every result.
The agriculture sector consists of activities in agriculture, hunting, forestry and fishing.
| Time frequency | Agricultural indicators | Unit of measure | Geopolitical entity (reporting) | Time | Value | Flag |
|---|---|---|---|---|---|---|
| Annual | Real factor income in agriculture per annual work unit (chain linked volumes) | Index, 2020=100 | European Union - 27 countries (from 2020) | 2020 | 20,255.66 | — |
| Annual | Real factor income in agriculture per annual work unit (chain linked volumes) | Index, 2020=100 | European Union - 27 countries (from 2020) | 2021 | 21,260.62 | — |
| Annual | Real factor income in agriculture per annual work unit (chain linked volumes) | Index, 2020=100 | European Union - 27 countries (from 2020) | 2022 | 24,096.65 | — |
| Annual | Real factor income in agriculture per annual work unit (chain linked volumes) | Index, 2020=100 | European Union - 27 countries (from 2020) | 2023 | 22,506.76 | — |
Reviewed Eurostat observations; customised presentation, not an official Eurostat embed. Showing 4 of 50.
Eurostat dataset aact_eaa06; Economic accounts for agriculture - agricultural income indicators; updated 2026-06-25T11:00:00+0200.
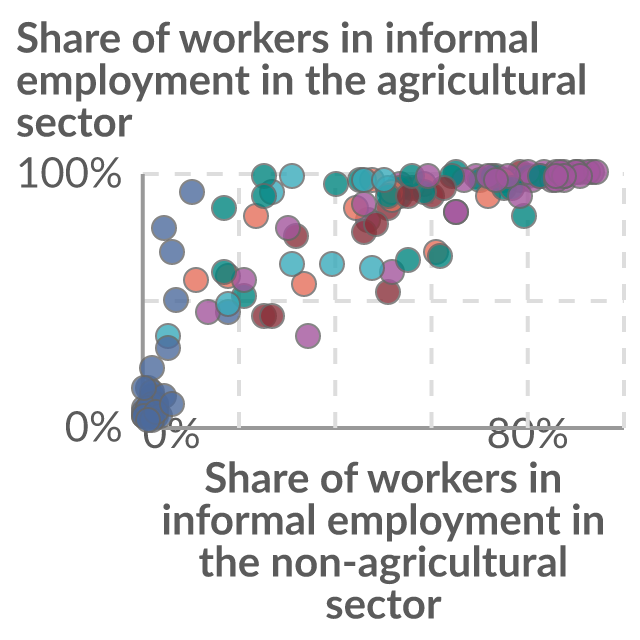
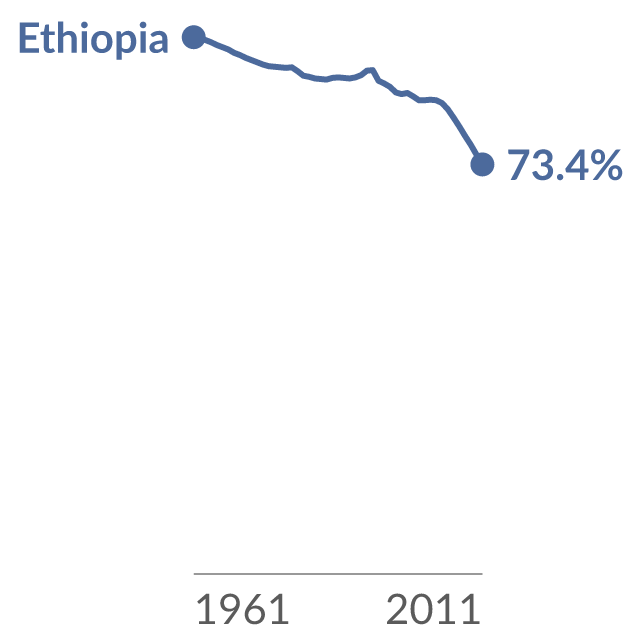
Share of employed people working in jobs that lack basic social or legal protection and employment benefits. Does not include illegal and illicit activities. The agricultural sector includes agriculture, forestry, and fishing.
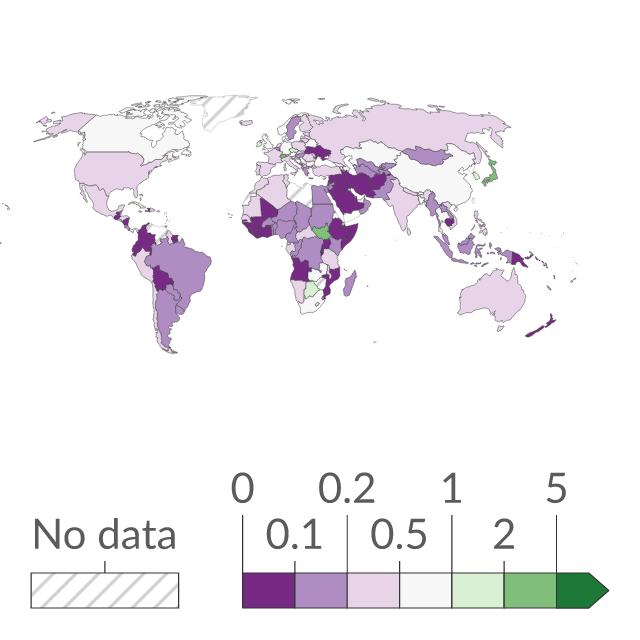
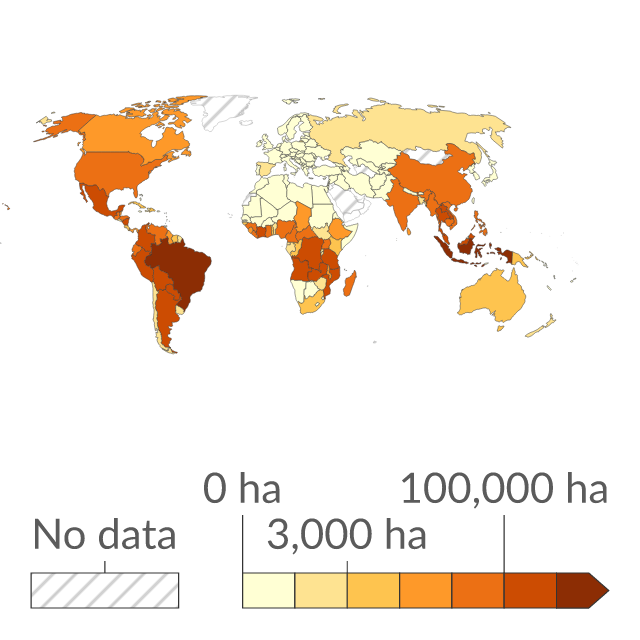
Estimated tree cover loss from agricultural deforestation is typically permanent tree cover loss attributed to small and large-scale agriculture.
| Time frequency | Unit of measure | Geopolitical entity (reporting) | Time | Value |
|---|---|---|---|---|
| Annual | Tonne | European Union - 27 countries (from 2020) | 2020 | 3,345,640 |
| Annual | Tonne | European Union - 27 countries (from 2020) | 2021 | 3,273,390 |
| Annual | Tonne | European Union - 27 countries (from 2020) | 2022 | 3,070,220 |
| Annual | Tonne | European Union - 27 countries (from 2020) | 2023 | 3,075,330 |
Reviewed Eurostat observations; customised presentation, not an official Eurostat embed. Showing 4 of 10.
Eurostat dataset sdg_02_60; Ammonia emissions from agriculture; updated 2026-09-10T23:00:00+0200.
| Time frequency | Air pollutants and greenhouse gases | Unit of measure | Source sectors for greenhouse gas emissions (Common reporting format, UNFCCC) | Geopolitical entity (reporting) | Time | Value |
|---|---|---|---|---|---|---|
| Annual | Greenhouse gases (CO2, N2O in CO2 equivalent, CH4 in CO2 equivalent, HFC in CO2 equivalent, PFC in CO2 equivalent, SF6 in CO2 equivalent, NF3 in CO2 equivalent) | Percentage | Agriculture | European Union - 27 countries (from 2020) | 2020 | 11.6 |
| Annual | Greenhouse gases (CO2, N2O in CO2 equivalent, CH4 in CO2 equivalent, HFC in CO2 equivalent, PFC in CO2 equivalent, SF6 in CO2 equivalent, NF3 in CO2 equivalent) | Percentage | Agriculture | European Union - 27 countries (from 2020) | 2021 | 10.9 |
| Annual | Greenhouse gases (CO2, N2O in CO2 equivalent, CH4 in CO2 equivalent, HFC in CO2 equivalent, PFC in CO2 equivalent, SF6 in CO2 equivalent, NF3 in CO2 equivalent) | Percentage | Agriculture | European Union - 27 countries (from 2020) | 2022 | 10.8 |
| Annual | Greenhouse gases (CO2, N2O in CO2 equivalent, CH4 in CO2 equivalent, HFC in CO2 equivalent, PFC in CO2 equivalent, SF6 in CO2 equivalent, NF3 in CO2 equivalent) | Percentage | Agriculture | European Union - 27 countries (from 2020) | 2023 | 11.8 |
Reviewed Eurostat observations; customised presentation, not an official Eurostat embed. Showing 4 of 30.
Eurostat dataset tai08; Greenhouse gas emissions from agriculture; updated 2026-06-02T23:00:00+0200.
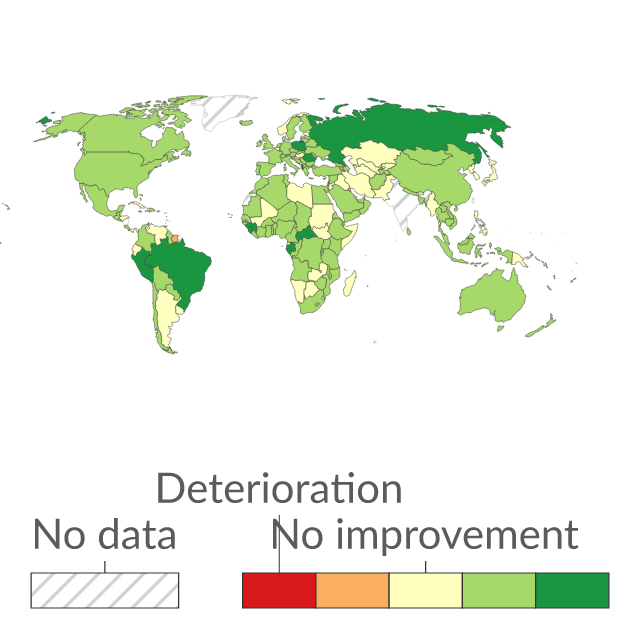
Trend score describing a country's progress toward productive and sustainable agriculture.
| Time frequency | Unit of measure | Source sectors for emissions of air pollutants (Nomenclature for reporting, CLRTAP) | Geopolitical entity (reporting) | Time | Value |
|---|---|---|---|---|---|
| Annual | Percentage | Manure management, inorganic N-fertilizers, animal manure and urine and dung of grazing animals (NFR3B1A-NFR3B4H, 3DA1, 3DA2A, 3DA3) | European Union - 27 countries (from 2020) | 2020 | 90.9 |
| Annual | Percentage | Manure management, inorganic N-fertilizers, animal manure and urine and dung of grazing animals (NFR3B1A-NFR3B4H, 3DA1, 3DA2A, 3DA3) | European Union - 27 countries (from 2020) | 2021 | 90.7 |
| Annual | Percentage | Manure management, inorganic N-fertilizers, animal manure and urine and dung of grazing animals (NFR3B1A-NFR3B4H, 3DA1, 3DA2A, 3DA3) | European Union - 27 countries (from 2020) | 2022 | 90.1 |
| Annual | Percentage | Manure management, inorganic N-fertilizers, animal manure and urine and dung of grazing animals (NFR3B1A-NFR3B4H, 3DA1, 3DA2A, 3DA3) | European Union - 27 countries (from 2020) | 2023 | 90.3 |
Reviewed Eurostat observations; customised presentation, not an official Eurostat embed. Showing 4 of 5.
Eurostat dataset tai07; Ammonia emissions from agriculture - % of total emissions; updated 2026-09-07T23:00:00+0200.
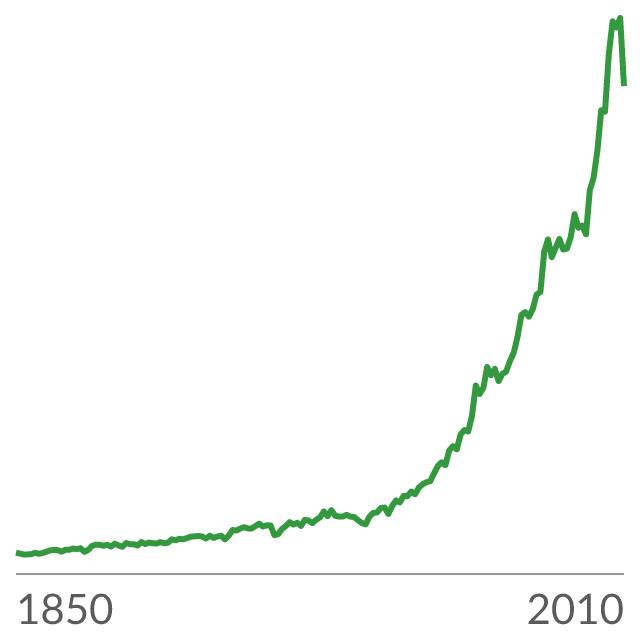
Labor productivity corresponds to the ratio between value added in agriculture (SEK, constant prices, 1910/12 price level), and number of people employed in agriculture.
| Time frequency | Agro-monetary items | Agricultural indicators | Unit of measure | Geopolitical entity (reporting) | Time | Value | Flag |
|---|---|---|---|---|---|---|---|
| Annual | Cereals (including seeds) | Production value at basic price | Million euro | European Union - 27 countries (from 2020) | 2020 | 47,948.91 | — |
| Annual | Cereals (including seeds) | Production value at basic price | Million euro | European Union - 27 countries (from 2020) | 2021 | 64,177.39 | — |
| Annual | Cereals (including seeds) | Production value at basic price | Million euro | European Union - 27 countries (from 2020) | 2022 | 79,633.84 | — |
| Annual | Cereals (including seeds) | Production value at basic price | Million euro | European Union - 27 countries (from 2020) | 2023 | 58,341.05 | — |
Reviewed Eurostat observations; customised presentation, not an official Eurostat embed. Showing 4 of 50.
Eurostat dataset aact_eaa01; Economic accounts for agriculture - values at current prices; updated 2026-05-13T11:00:00+0200.
| Time frequency | Agro-monetary items | Agricultural indicators | Unit of measure | Geopolitical entity (reporting) | Time | Value | Flag |
|---|---|---|---|---|---|---|---|
| Annual | Cereals (including seeds) | Production value at basic price | Chain linked volumes (2020), million euro | European Union - 27 countries (from 2020) | 2020 | 47,948.91 | — |
| Annual | Cereals (including seeds) | Production value at basic price | Chain linked volumes (2020), million euro | European Union - 27 countries (from 2020) | 2021 | 62,477.95 | — |
| Annual | Cereals (including seeds) | Production value at basic price | Chain linked volumes (2020), million euro | European Union - 27 countries (from 2020) | 2022 | 72,769.76 | — |
| Annual | Cereals (including seeds) | Production value at basic price | Chain linked volumes (2020), million euro | European Union - 27 countries (from 2020) | 2023 | 49,493.48 | — |
Reviewed Eurostat observations; customised presentation, not an official Eurostat embed. Showing 4 of 50.
Eurostat dataset aact_eaa04; Economic accounts for agriculture - values at real prices; updated 2026-05-13T11:00:00+0200.
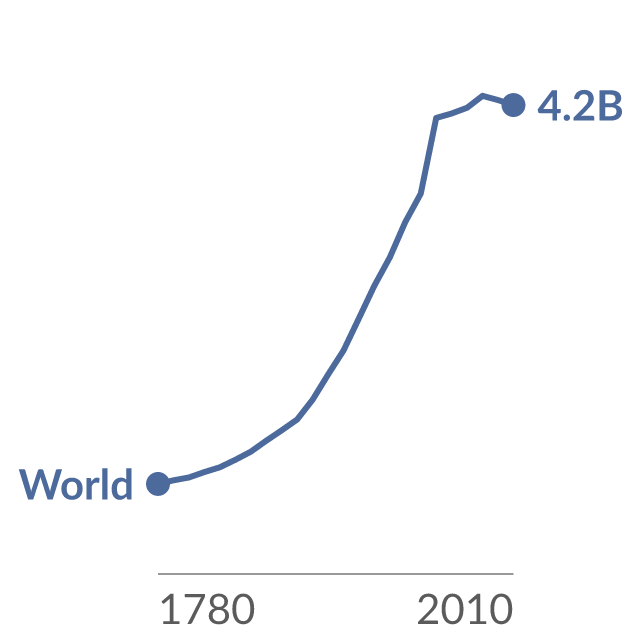
Agricultural land use is the sum of croplands and pasture – land used for grazing livestock. It is measured in hectares.
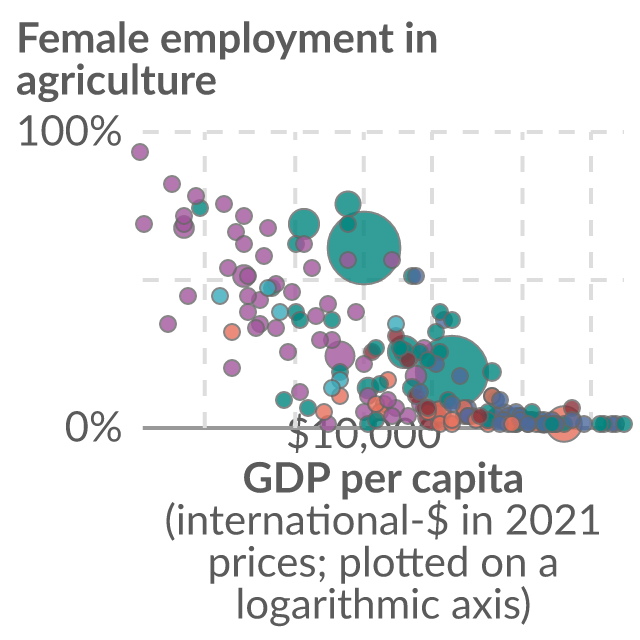
The agriculture sector consists of activities in agriculture, hunting, forestry and fishing. GDP per capita is adjusted for inflation and differences in living costs between countries.
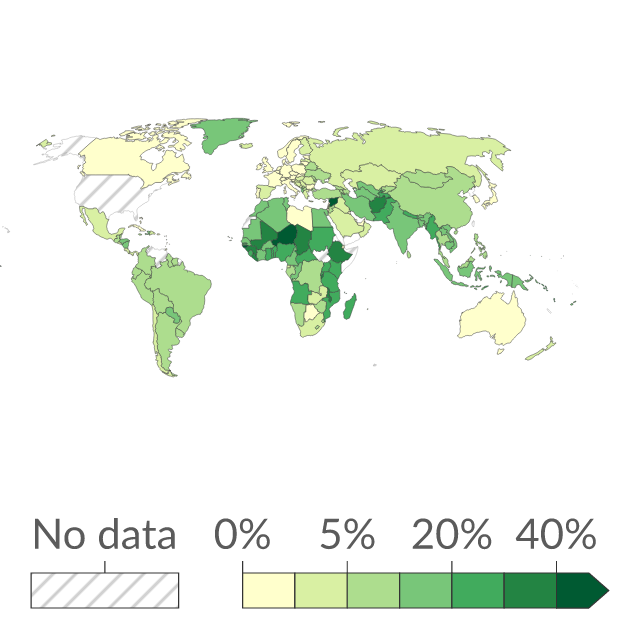
This is measured as the value added from agriculture, forestry and fishing products as a share of gross domestic product (GDP).
| Time frequency | Agro-monetary items | Agricultural indicators | Unit of measure | Geopolitical entity (reporting) | Time | Value | Flag |
|---|---|---|---|---|---|---|---|
| Annual | Cereals (including seeds) | Production value at basic price | Million euro | European Union - 27 countries (from 2020) | 2020 | 46,208.52 | — |
| Annual | Cereals (including seeds) | Production value at basic price | Million euro | European Union - 27 countries (from 2020) | 2021 | 52,059.77 | — |
| Annual | Cereals (including seeds) | Production value at basic price | Million euro | European Union - 27 countries (from 2020) | 2022 | 57,598.18 | — |
| Annual | Cereals (including seeds) | Production value at basic price | Million euro | European Union - 27 countries (from 2020) | 2023 | 80,290.2 | — |
Reviewed Eurostat observations; customised presentation, not an official Eurostat embed. Showing 4 of 50.
Eurostat dataset aact_eaa02; Economic accounts for agriculture - values at n-1 prices; updated 2026-05-13T11:00:00+0200.
| Time frequency | Agro-monetary items | Agricultural indicators | Unit of measure | Geopolitical entity (reporting) | Time | Value | Flag |
|---|---|---|---|---|---|---|---|
| Annual | Cereals (including seeds) | Production value at basic price | Chain linked volumes (2020), million euro | European Union - 27 countries (from 2020) | 2020 | 47,948.91 | — |
| Annual | Cereals (including seeds) | Production value at basic price | Chain linked volumes (2020), million euro | European Union - 27 countries (from 2020) | 2021 | 52,059.77 | — |
| Annual | Cereals (including seeds) | Production value at basic price | Chain linked volumes (2020), million euro | European Union - 27 countries (from 2020) | 2022 | 46,792.27 | — |
| Annual | Cereals (including seeds) | Production value at basic price | Chain linked volumes (2020), million euro | European Union - 27 countries (from 2020) | 2023 | 47,114.62 | — |
Reviewed Eurostat observations; customised presentation, not an official Eurostat embed. Showing 4 of 50.
Eurostat dataset aact_eaa03; Economic accounts for agriculture - values at reference year prices; updated 2026-05-13T11:00:00+0200.
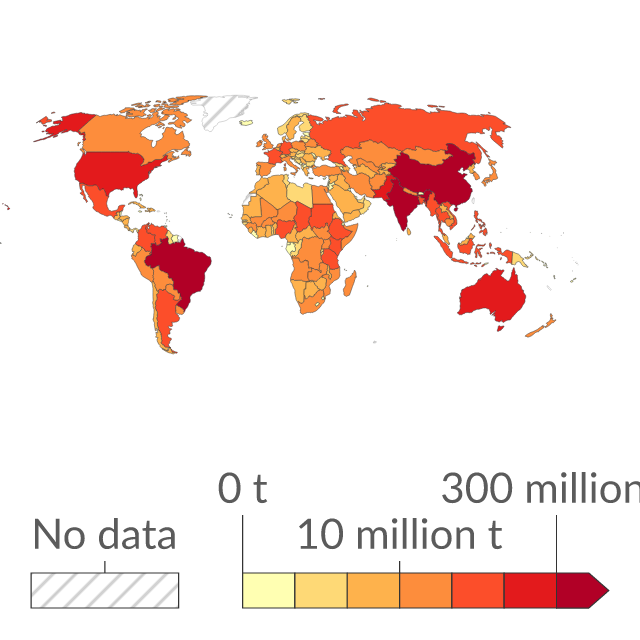
Methane (CH₄) emissions are measured in tonnes of carbon dioxide-equivalents.
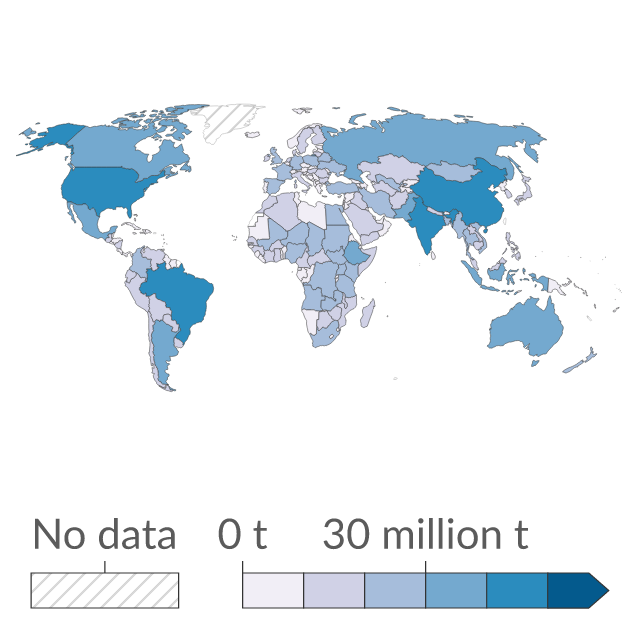
Nitrous oxide (N₂O) emissions are measured in tonnes of carbon dioxide-equivalents.
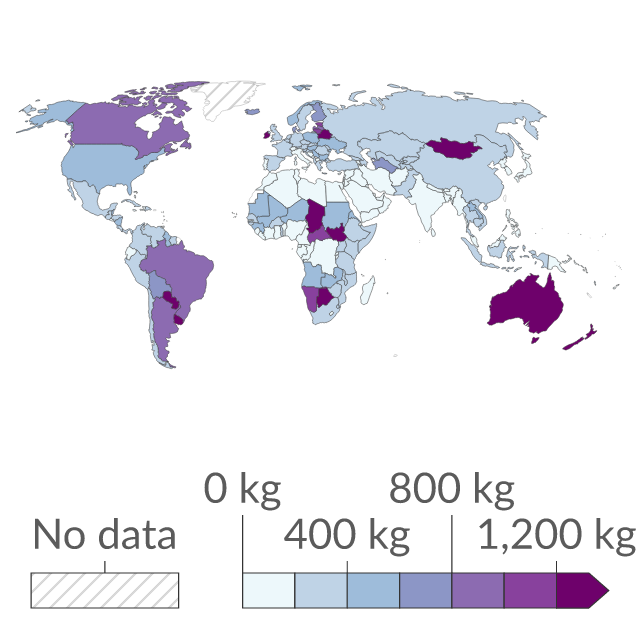
Nitrous oxide (N₂O) emissions are measured in kilograms of carbon dioxide-equivalents.
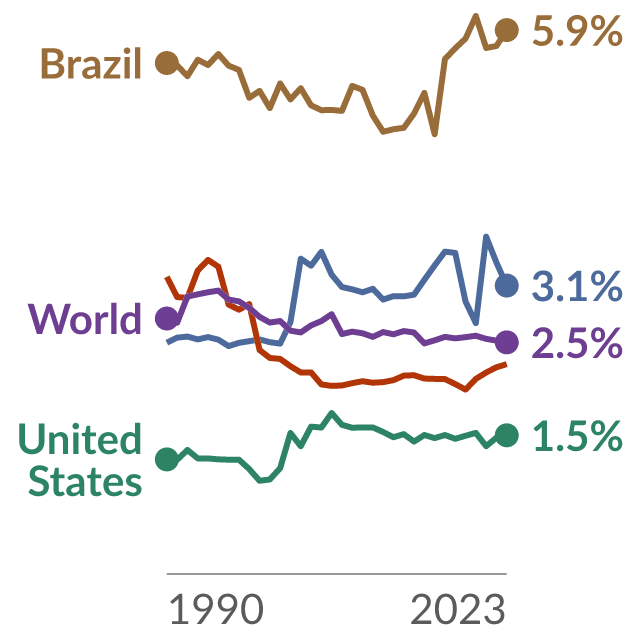
Energy consumed by the agriculture, forestry and fishing sector, measured as a percentage of total final energy consumption.
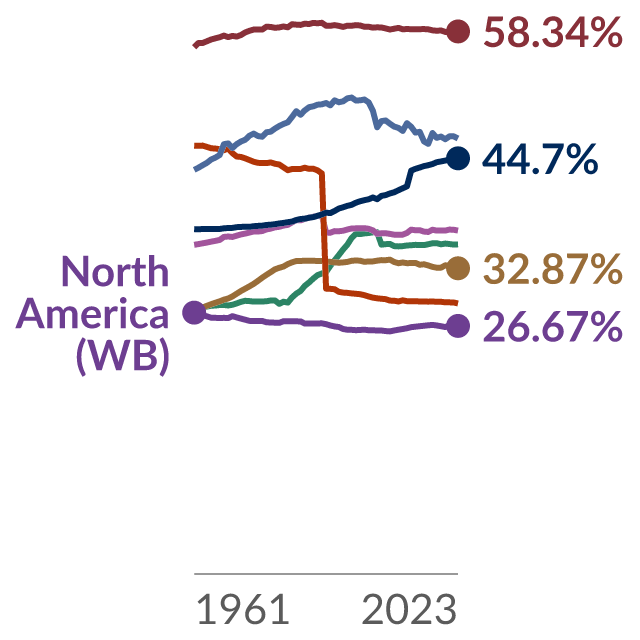
The share of land area used for agriculture, measured as a percentage of total land area. Agricultural land refers to the share of land area that is arable, under permanent crops, and under permanent pastures.