Where publishers find data.

Results for “agriculture”

Source links, freshness and reuse rights stay visible on every result.

Page 4 · 24 results
Filters
FiltersClear
Asset type
Source
Commercial use
Rights review
Freshness
PreviewSubmitted image
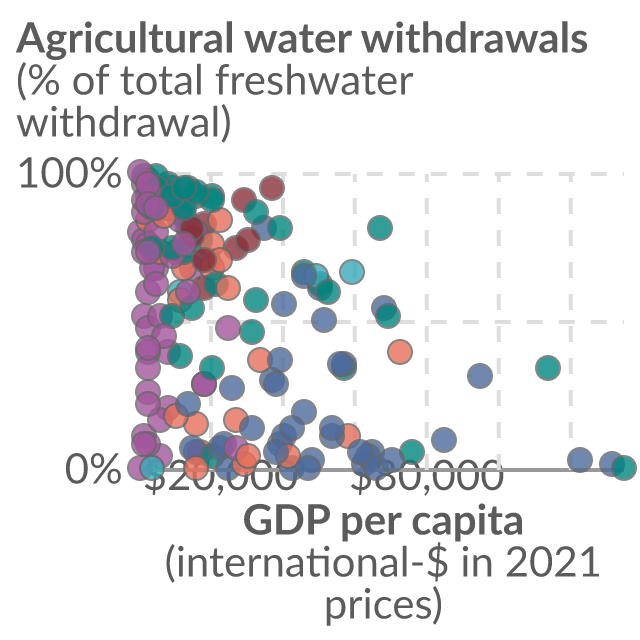
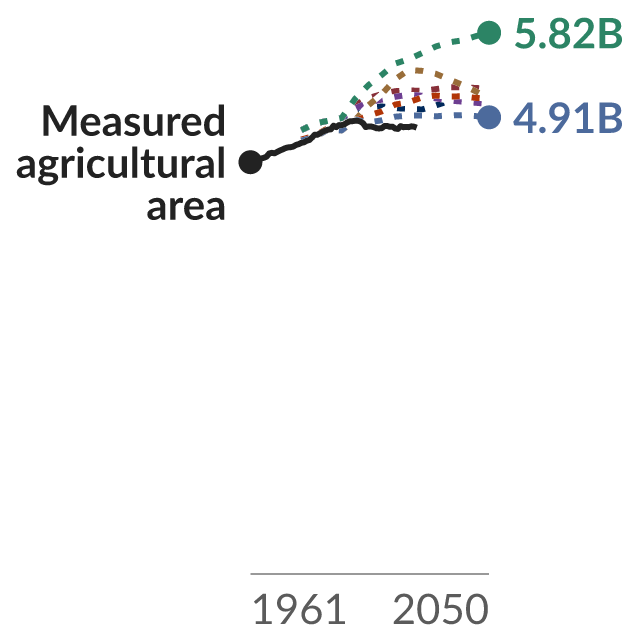
Preview of Projections for global peak agricultural land
ChartOur World in Data

Projections for global peak agricultural land

Projected trends in global agricultural area extent by various sources, measured in hectares. Projections include those from the UN Food and Agricultural Organization (FAO), International Assessment of Agricultural Knowledge, Science and Technology for Development (IAASTD); OECD, and scenarios from the Millennium Ecosystem Assessment (MEA). Also shown is the actual agricultural area as reported by the UN FAO.

Source
Our World in Data
Updated
25 Feb 2026
Data previewapri_lrnt
Reviewed data preview from apri_lrnt
Time frequencyUnit of measureAgricultural productsGeopolitical entity (reporting)TimeValueFlag
AnnualEuro per hectareArable land and/or permanent grasslandEuropean Union - 27 countries (from 2020)2020225e
AnnualEuro per hectareArable land and/or permanent grasslandEuropean Union - 27 countries (from 2020)2021240e
AnnualEuro per hectareArable land and/or permanent grasslandEuropean Union - 27 countries (from 2020)2022266e
AnnualEuro per hectareArable land and/or permanent grasslandEuropean Union - 27 countries (from 2020)2023277e

Reviewed Eurostat observations; customised presentation, not an official Eurostat embed. Showing 4 of 15.

DatasetEurostat

Agricultural land renting prices for one year by region

Eurostat dataset apri_lrnt; Agricultural land renting prices for one year by region; updated 2026-07-07T23:00:00+0200.

Source
Eurostat
Updated
07 Jul 2026
Data previewapri_pi_ina
Reviewed data preview from apri_pi_ina
Time frequencyAgro-monetary itemsPrice adjustmentUnit of measureGeopolitical entity (reporting)TimeValueFlag
AnnualGoods and services currently consumed in agriculture (Input 1)Nominal indexIndex, 2020=100European Union - 27 countries (from 2020)2020100—
AnnualGoods and services currently consumed in agriculture (Input 1)Nominal indexIndex, 2020=100European Union - 27 countries (from 2020)2021111.94—
AnnualGoods and services currently consumed in agriculture (Input 1)Nominal indexIndex, 2020=100European Union - 27 countries (from 2020)2022146.88—
AnnualGoods and services currently consumed in agriculture (Input 1)Nominal indexIndex, 2020=100European Union - 27 countries (from 2020)2023139.97—

Reviewed Eurostat observations; customised presentation, not an official Eurostat embed. Showing 4 of 50.

DatasetEurostat

Price indices of the means of agricultural production, input - annual data

Eurostat dataset apri_pi_ina; Price indices of the means of agricultural production, input - annual data; updated 2026-09-10T11:00:00+0200.

Source
Eurostat
Updated
10 Sept 2026
Data previewapri_pi_inq
Reviewed data preview from apri_pi_inq
Time frequencyAgro-monetary itemsPrice adjustmentUnit of measureGeopolitical entity (reporting)TimeValue
QuarterlyGoods and services currently consumed in agriculture (Input 1)Nominal indexIndex, 2020=100European Union - 27 countries (from 2020)2020-Q1101.16
QuarterlyGoods and services currently consumed in agriculture (Input 1)Nominal indexIndex, 2020=100European Union - 27 countries (from 2020)2020-Q299.36
QuarterlyGoods and services currently consumed in agriculture (Input 1)Nominal indexIndex, 2020=100European Union - 27 countries (from 2020)2020-Q399.07
QuarterlyGoods and services currently consumed in agriculture (Input 1)Nominal indexIndex, 2020=100European Union - 27 countries (from 2020)2020-Q4100.4

Reviewed Eurostat observations; customised presentation, not an official Eurostat embed. Showing 4 of 50.

DatasetEurostat

Price indices of the means of agricultural production, input - quarterly data

Eurostat dataset apri_pi_inq; Price indices of the means of agricultural production, input - quarterly data; updated 2026-09-10T11:00:00+0200.

Source
Eurostat
Updated
10 Sept 2026
Data previewef_oga_type
Reviewed data preview from ef_oga_type
Time frequencyStatistical informationFarm typeStandard output in EurosUtilised agricultural areaAge classTypes of other gainful activity (OGA) related to the agricultural holdingUnit of measureGeopolitical entity (reporting)TimeValue
AnnualAbove thresholdTotalTotalTotalTotalTotalAnnual working unit (AWU)European Union - 27 countries (from 2020)20207,112,420
AnnualAbove thresholdTotalTotalTotalTotalTotalAnnual working unit (AWU)European Union - 27 countries (from 2020)20236,876,570
AnnualAbove thresholdTotalTotalTotalTotalTotalHoldingEuropean Union - 27 countries (from 2020)20206,364,700
AnnualAbove thresholdTotalTotalTotalTotalTotalHoldingEuropean Union - 27 countries (from 2020)20236,137,960

Reviewed Eurostat observations; customised presentation, not an official Eurostat embed. Showing 4 of 50.

DatasetEurostat

Type of other gainful activities directly related to the agricultural holdings by age of the manager, utilised agricultural area, type and economic size of the farm and NUTS 2 region

Eurostat dataset ef_oga_type; Type of other gainful activities directly related to the agricultural holdings by age of the manager, utilised agricultural area, type and economic size of the farm and NUTS 2 region; updated 2026-06-17T23:00:00+0200.

Source
Eurostat
Updated
17 Jun 2026
Data previewef_lf_size
Reviewed data preview from ef_lf_size
Time frequencyUtilised agricultural areaLabour force and employment statusFarm typeStatistical informationUnit of measureGeopolitical entity (reporting)TimeValue
AnnualTotalTotalTotalAbove thresholdAnnual working unit (AWU)European Union - 27 countries (from 2020)20207,112,420
AnnualTotalTotalTotalAbove thresholdAnnual working unit (AWU)European Union - 27 countries (from 2020)20236,876,570
AnnualTotalTotalTotalAbove thresholdPersonEuropean Union - 27 countries (from 2020)202013,175,540
AnnualTotalTotalTotalAbove thresholdPersonEuropean Union - 27 countries (from 2020)202312,517,440

Reviewed Eurostat observations; customised presentation, not an official Eurostat embed. Showing 4 of 50.

DatasetEurostat

Agricultural labour force by size of the farm and NUTS 2 region

Eurostat dataset ef_lf_size; Agricultural labour force by size of the farm and NUTS 2 region; updated 2026-06-17T23:00:00+0200.

Source
Eurostat
Updated
17 Jun 2026
Data previewaact_ali01
Reviewed data preview from aact_ali01
Time frequencyAgro-monetary itemsUnit of measureGeopolitical entity (reporting)TimeValueFlag
AnnualTotal agricultural labour inputThousand annual working units (AWU)European Union - 27 countries (from 2020)20207,958.89—
AnnualTotal agricultural labour inputThousand annual working units (AWU)European Union - 27 countries (from 2020)20217,950.3—
AnnualTotal agricultural labour inputThousand annual working units (AWU)European Union - 27 countries (from 2020)20227,835.42—
AnnualTotal agricultural labour inputThousand annual working units (AWU)European Union - 27 countries (from 2020)20237,591.97—

Reviewed Eurostat observations; customised presentation, not an official Eurostat embed. Showing 4 of 18.

DatasetEurostat

Agricultural labour input statistics - absolute figures (thousand annual work units)

Eurostat dataset aact_ali01; Agricultural labour input statistics - absolute figures (thousand annual work units); updated 2026-05-13T11:00:00+0200.

Source
Eurostat
Updated
13 May 2026
Data previewsdg_02_20
Reviewed data preview from sdg_02_20
Time frequencyAgricultural indicatorsUnit of measureGeopolitical entity (reporting)TimeValueFlag
AnnualReal factor income in agriculture per annual work unit (chain linked volumes)Chain linked volumes, index 2020=100European Union - 27 countries (from 2020)2020100—
AnnualReal factor income in agriculture per annual work unit (chain linked volumes)Chain linked volumes, index 2020=100European Union - 27 countries (from 2020)2021104.96—
AnnualReal factor income in agriculture per annual work unit (chain linked volumes)Chain linked volumes, index 2020=100European Union - 27 countries (from 2020)2022118.96—
AnnualReal factor income in agriculture per annual work unit (chain linked volumes)Chain linked volumes, index 2020=100European Union - 27 countries (from 2020)2023111.11—

Reviewed Eurostat observations; customised presentation, not an official Eurostat embed. Showing 4 of 12.

DatasetEurostat

Agricultural real factor income per annual work unit (AWU)

Eurostat dataset sdg_02_20; Agricultural real factor income per annual work unit (AWU); updated 2026-06-25T11:00:00+0200.

Source
Eurostat
Updated
25 Jun 2026
Data previewtag00056
Reviewed data preview from tag00056
Time frequencyAgro-monetary itemsAgricultural indicatorsUnit of measureGeopolitical entity (reporting)TimeValueFlag
AnnualGross value added at basic pricesProduction value at basic priceMillion euroEuropean Union - 27 countries (from 2020)2020174,620.52—
AnnualGross value added at basic pricesProduction value at basic priceMillion euroEuropean Union - 27 countries (from 2020)2021187,080.47—
AnnualGross value added at basic pricesProduction value at basic priceMillion euroEuropean Union - 27 countries (from 2020)2022220,814.09—
AnnualGross value added at basic pricesProduction value at basic priceMillion euroEuropean Union - 27 countries (from 2020)2023221,605.06—

Reviewed Eurostat observations; customised presentation, not an official Eurostat embed. Showing 4 of 12.

DatasetEurostat

Gross value added of the agricultural industry - basic and producer prices

Eurostat dataset tag00056; Gross value added of the agricultural industry - basic and producer prices; updated 2026-05-13T11:00:00+0200.

Source
Eurostat
Updated
13 May 2026
Data previewef_fsi_physz
Reviewed data preview from ef_fsi_physz
Time frequencyUtilised agricultural areaLegal formUnit of measureGeopolitical entity (reporting)TimeValueFlag
AnnualTotalTotalEuroEuropean Union - 27 countries (from 2020)2020360,340,624,700—
AnnualTotalTotalEuroEuropean Union - 27 countries (from 2020)2023393,987,235,640i
AnnualTotalTotalHectareEuropean Union - 27 countries (from 2020)2020157,414,160—
AnnualTotalTotalHectareEuropean Union - 27 countries (from 2020)2023156,206,590i

Reviewed Eurostat observations; customised presentation, not an official Eurostat embed. Showing 4 of 50.

DatasetEurostat

Physical size of farms by utilised agricultural area and legal form

Eurostat dataset ef_fsi_physz; Physical size of farms by utilised agricultural area and legal form; updated 2026-06-17T23:00:00+0200.

Source
Eurostat
Updated
17 Jun 2026
Data previewef_m_sexhold_sh
Reviewed data preview from ef_m_sexhold_sh
Time frequencyStatistical informationTenure statusSexAgricultural indicatorsUnit of measureGeopolitical entity (reporting)TimeValue
AnnualStandard errorTotalTotalShare of tenure typeHoldingEuropean Union - 27 countries (from 2020)20200
AnnualStandard errorTotalTotalShare of tenure typePercentageEuropean Union - 27 countries (from 2020)20200
AnnualStandard errorTotalTotalShare of sex of holderHoldingEuropean Union - 27 countries (from 2020)20200
AnnualStandard errorTotalTotalShare of sex of holderPercentageEuropean Union - 27 countries (from 2020)20200

Reviewed Eurostat observations; customised presentation, not an official Eurostat embed. Showing 4 of 50.

DatasetEurostat

Share of agricultural holdings by sex of holder and type of tenure

Eurostat dataset ef_m_sexhold_sh; Share of agricultural holdings by sex of holder and type of tenure; updated 2026-06-17T23:00:00+0200.

Source
Eurostat
Updated
17 Jun 2026
Data previewtai03
Reviewed data preview from tai03
Time frequencyIrrigation of agricultural areaUnit of measureGeopolitical entity (reporting)TimeValueFlag
AnnualIrrigable utilised agricultural areaPercentageEuropean Union - 27 countries (from 2020)20209.9—
AnnualIrrigable utilised agricultural areaPercentageEuropean Union - 27 countries (from 2020)20239.6i
AnnualIrrigated utilised agricultural areaPercentageEuropean Union - 27 countries (from 2020)20236.5i

Reviewed Eurostat observations; customised presentation, not an official Eurostat embed.

DatasetEurostat

Share of irrigable and irrigated areas in utilised agricultural area (UAA)

Eurostat dataset tai03; Share of irrigable and irrigated areas in utilised agricultural area (UAA); updated 2026-07-21T23:00:00+0200.

Source
Eurostat
Updated
21 Jul 2026
Data previewtai05
Reviewed data preview from tai05
Time frequencyStandard output in EurosCropsUnit of measureGeopolitical entity (reporting)TimeValueFlag
AnnualTotalArable landPercentageEuropean Union - 27 countries (from 2020)202062.3—
AnnualTotalArable landPercentageEuropean Union - 27 countries (from 2020)202362.5i
AnnualTotalPermanent grassland - outdoorPercentageEuropean Union - 27 countries (from 2020)202030.5—
AnnualTotalPermanent grassland - outdoorPercentageEuropean Union - 27 countries (from 2020)202330.2i

Reviewed Eurostat observations; customised presentation, not an official Eurostat embed. Showing 4 of 6.

DatasetEurostat

Share of main land types in utilised agricultural area (UAA)

Eurostat dataset tai05; Share of main land types in utilised agricultural area (UAA); updated 2026-06-17T23:00:00+0200.

Source
Eurostat
Updated
17 Jun 2026